If you'd like to start a 90-day free trial of our exclusive content, you can do so usingthis link. If you have any questions or would like to see samples of our past content, feel free to get in touch with us.
Summary: PCE Nowcasts
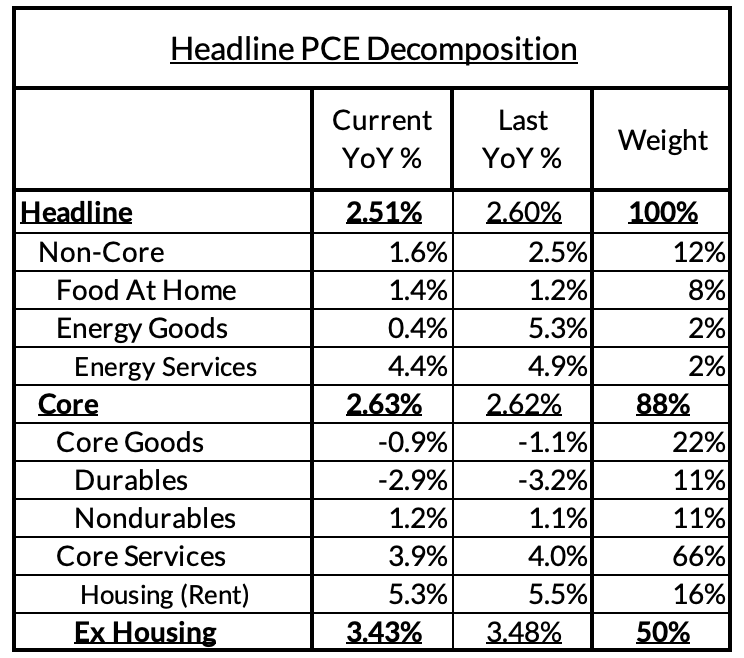
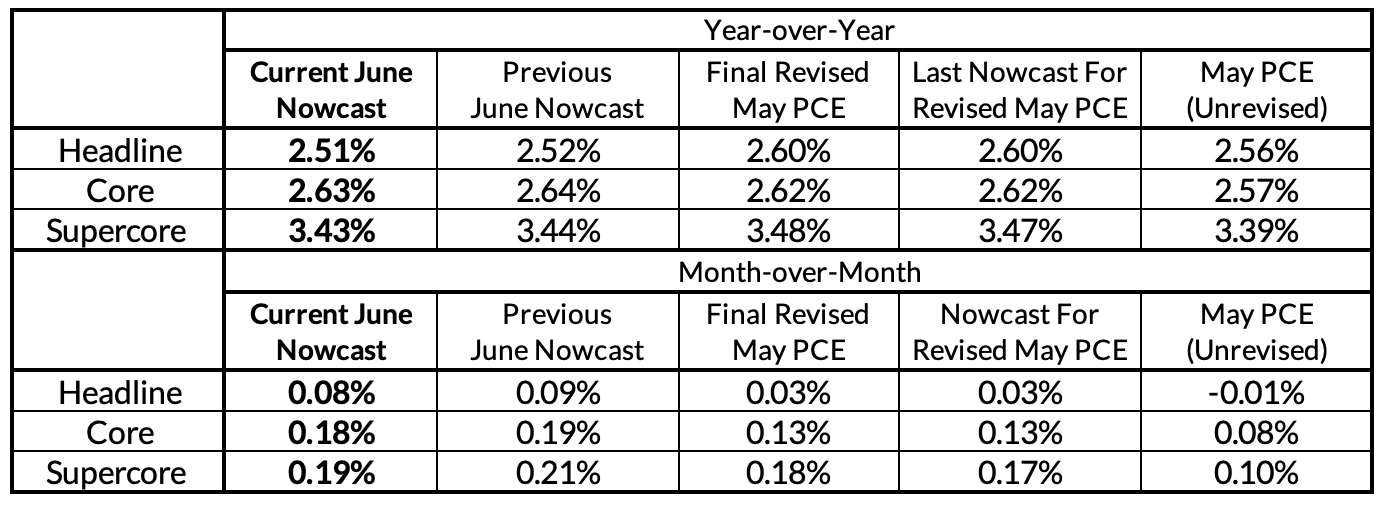
The final monthly PCE release came within a basis point of our final nowcast yesterday across virtually all of the relevant gauges. Our modeling of revisions captured the major upside shift in the May reading following the PPI release alongside the marginal shifts across each quarter following the GDP release. All things considered, today's data appears to be the best-case scenario given what we learned yesterday. Core PCE is 2.63% year-over-year with signs of further deceleration given the autocorrelated and inertial characteristics of housing PCE inflation.
Fed Implications
The Fed will view this release as a sign that, if it continues into the coming 1-2 months, will warrant the beginning of interest rate normalization in September. The only remaining Tier 1 data release from here is the Employment Cost Index on Wednesday (the day the FOMC ultimately releases its statement). Odds are that the Fed will see enough evidence to conclude that the labor market has substantially cooled and can no longer be characterized as hot or overheated.
Our Own View: Base-Case Looks Fine But Risk Management Vulnerabilities Abound
Today's PCE release merely confirms the progress we've been observing over the past two months, with the relief in rent and OER inflation components most noteworthy for the inflation outlook. While we suspect the labor market is largely on decent ground, but the apparent cooling is itself reason for the Fed to be pivoting more aggressively than they've demonstrated thus far (there is still no conclusive convergence towards a September cut). It is probably the case that the 0.4% rise in the unemployment rate is not a cause for excess alarm when so much of the rise has been driven by higher participation (rather than outright job loss), but the rise is (1) still indicative of a labor market slowdown and (2) empirically consistent with elevated recession risk.
We only receive the July jobs report after the July FOMC meeting but if it turns out that the rising unemployment rate reflects adverse signal, and not merely noise and participation improvement, the Fed may find itself more aggressively behind the curve. Just based on realized labor market and inflation data and adopting most standard policy rule specifications, the Fed is already more than 100 basis points "too tight." The longer the Fed lags, the stronger the justification for beginning with larger and faster increments of interest rate reduction (e.g. starting with a 50 basis point cut; cutting sequentially at each meeting). A 5.33% Fed Funds Rate looks increasingly difficult to reconcile with where the data is.
Stack on any additional forward-looking recession risk, as the unemployment rate suggests and could foretell next Friday, and the Fed may soon be forced into larger and sharper interest rate adjustments, which only magnifies the potential scope for policy error. In certain credible scenarios, the Fed will look back on the July meeting as a missed opportunity to commence a smoother and more careful interest rate adjustment process. Let's hope their baseline scenario (and ours) comes to fruition, or else they will soon be forced into a more difficult and haphazard set of decisions.
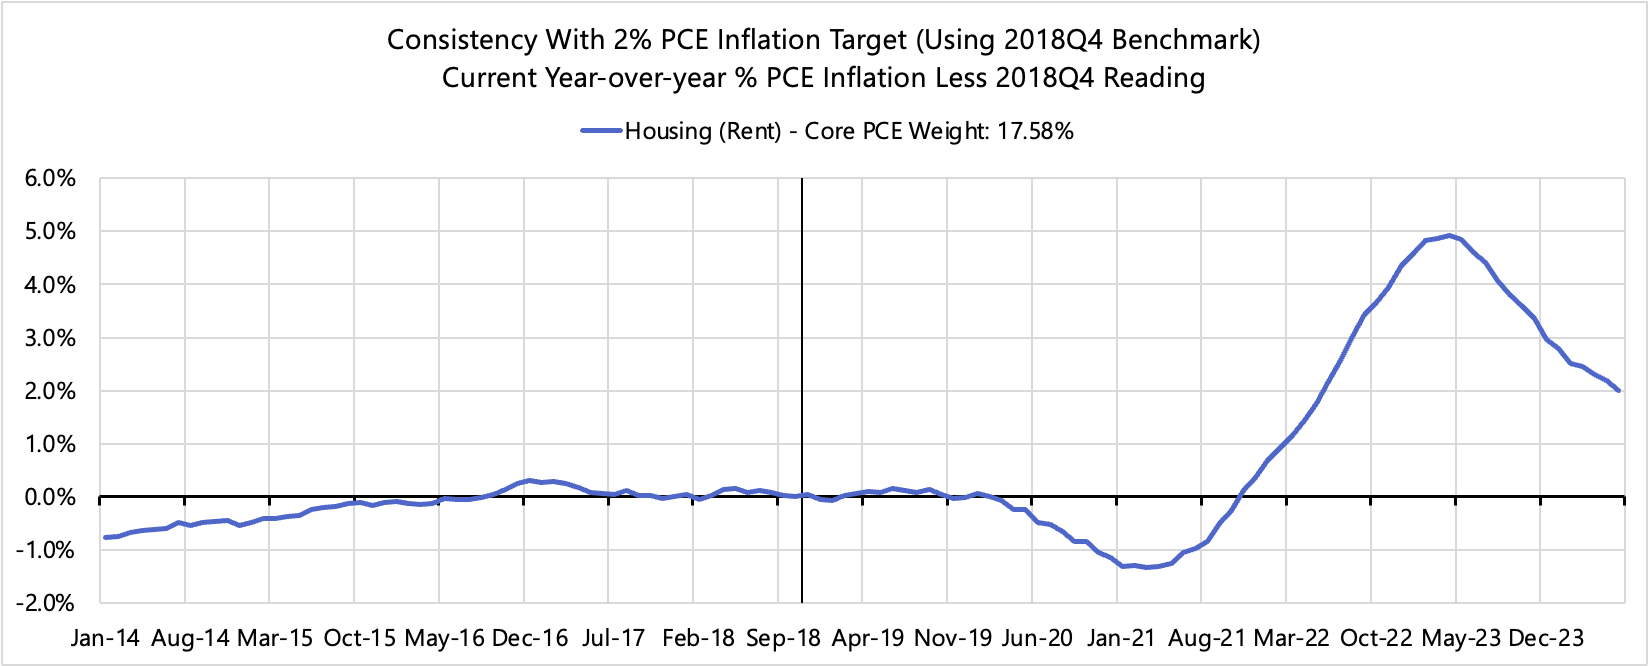
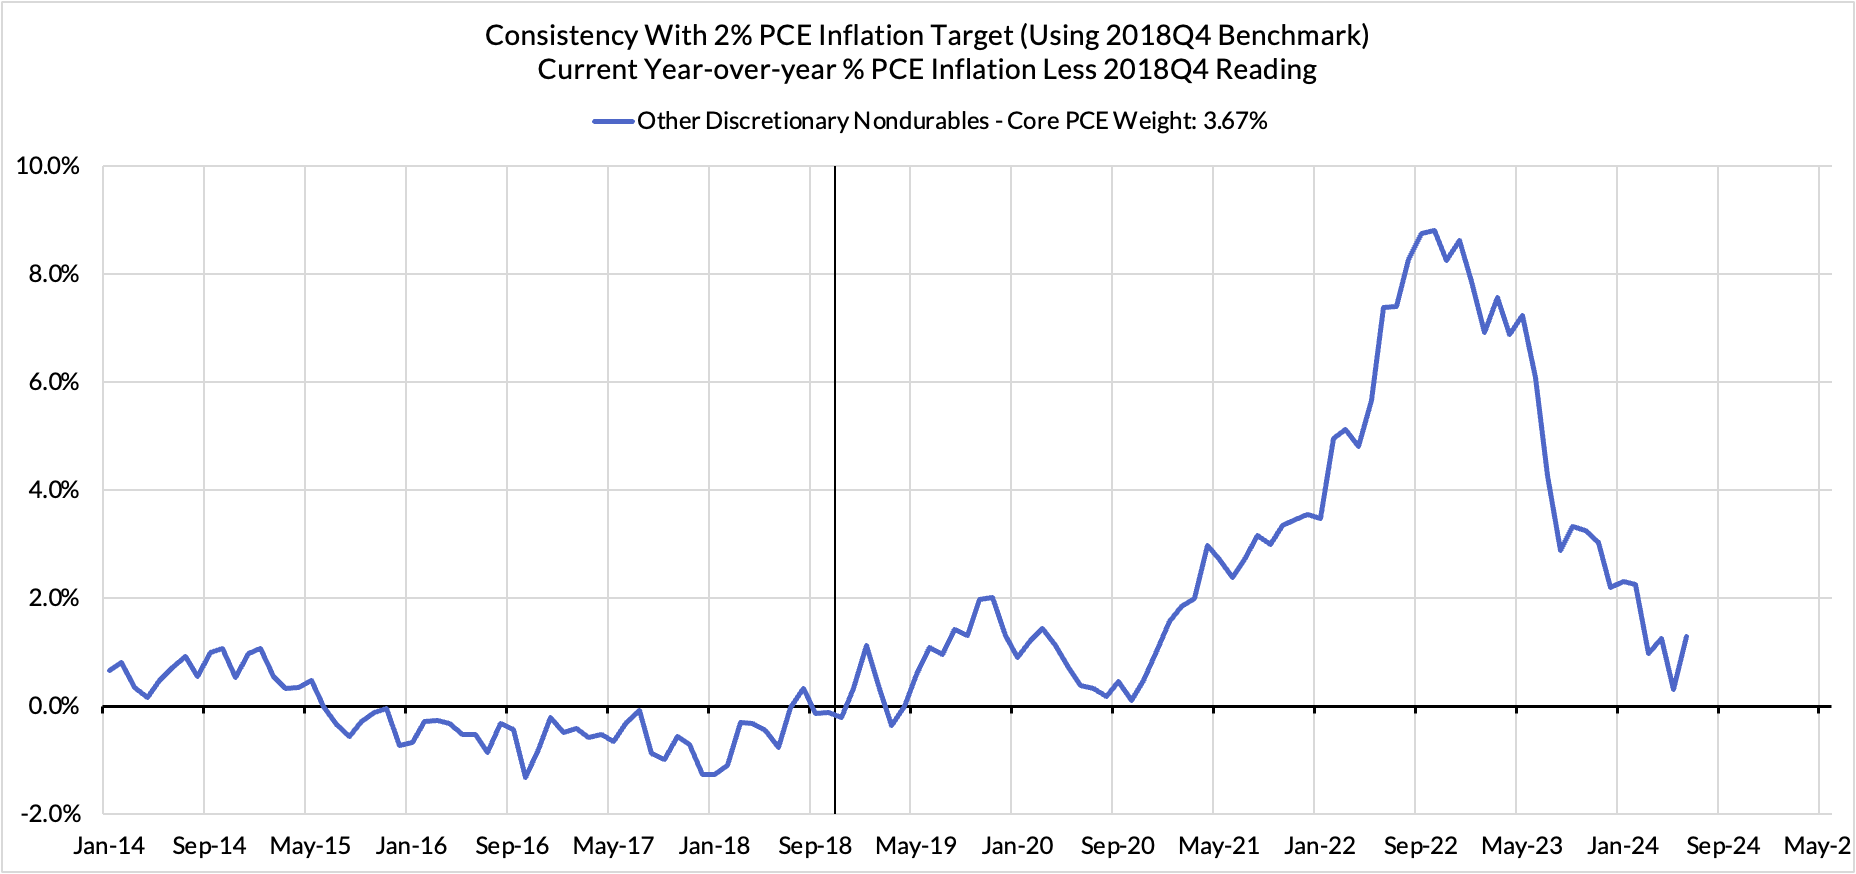
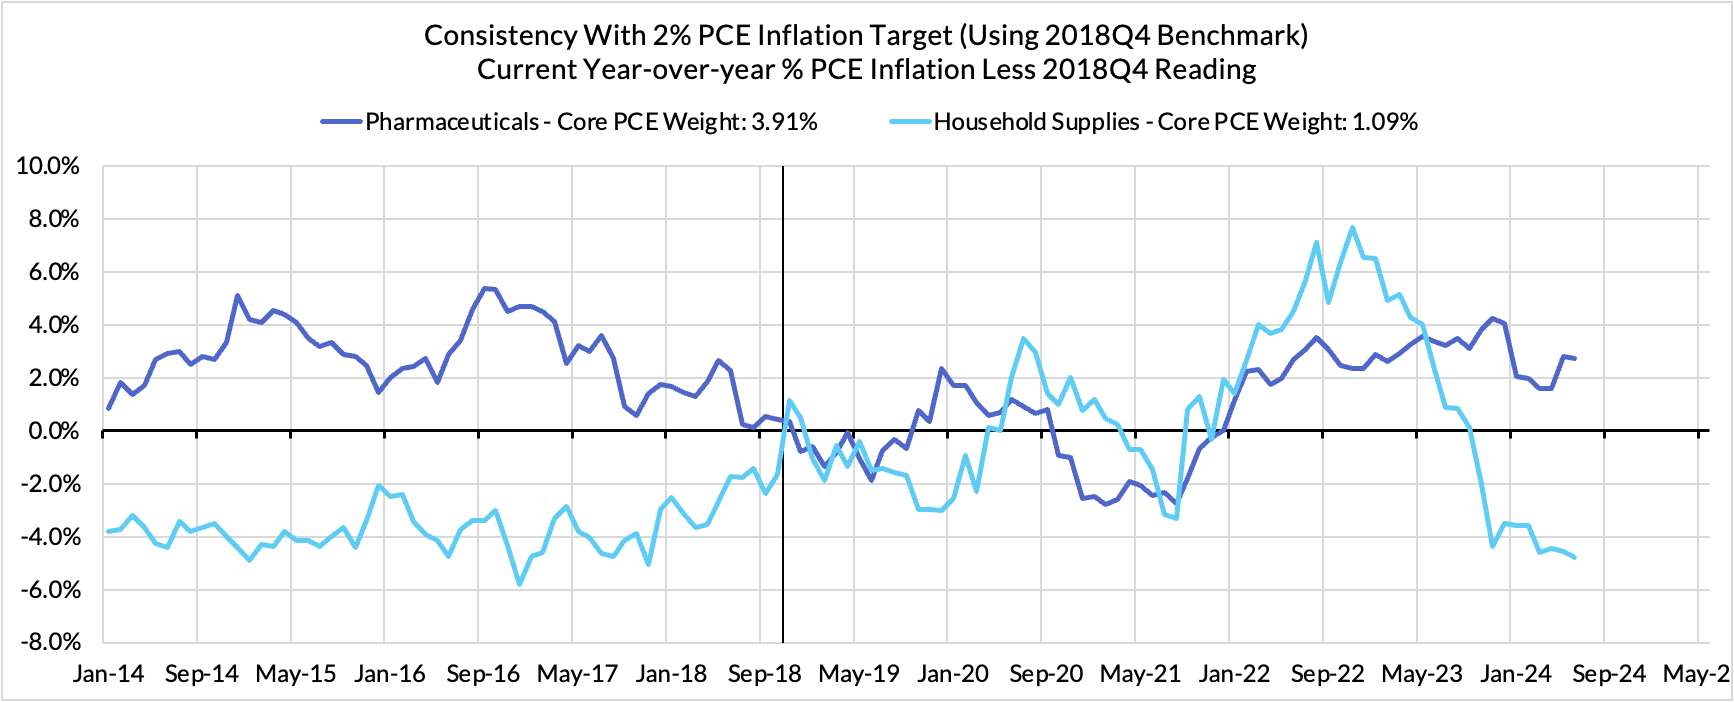
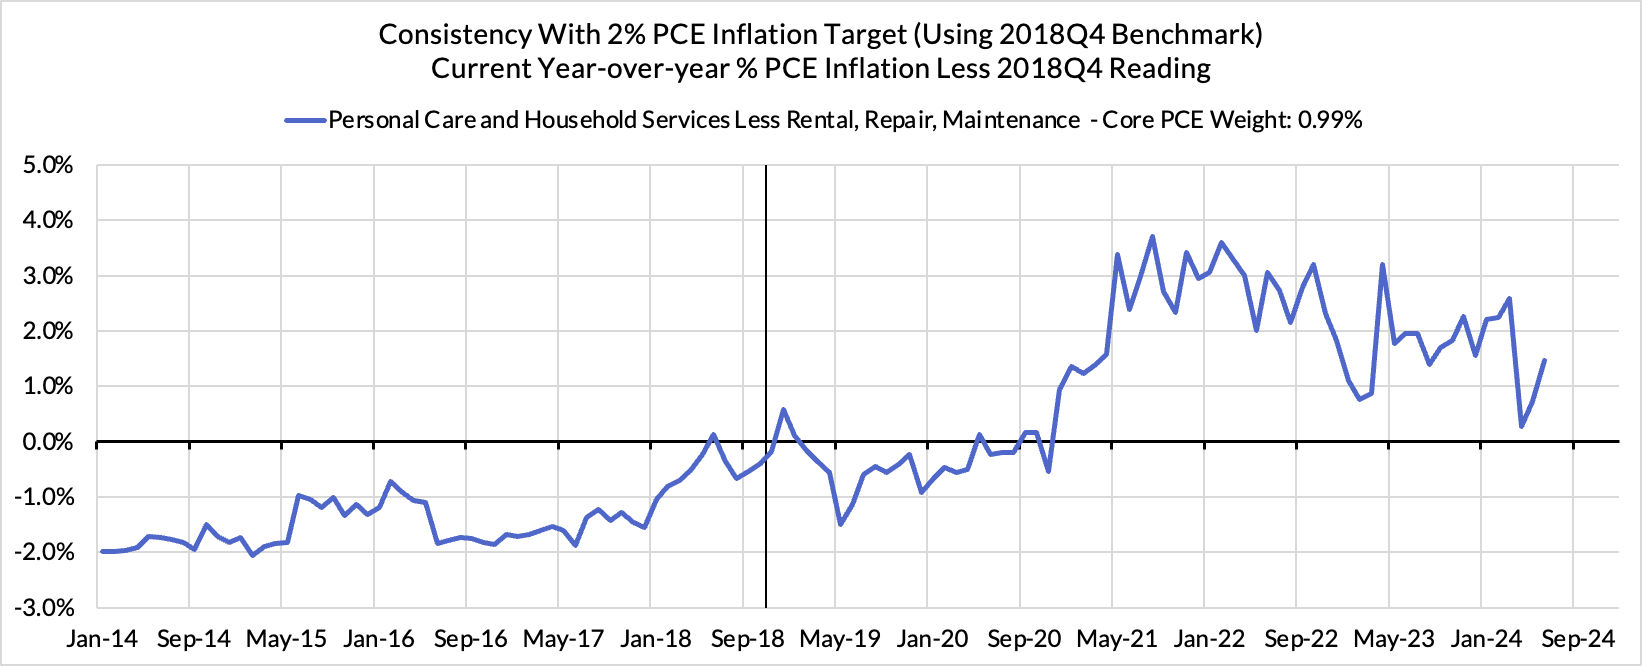
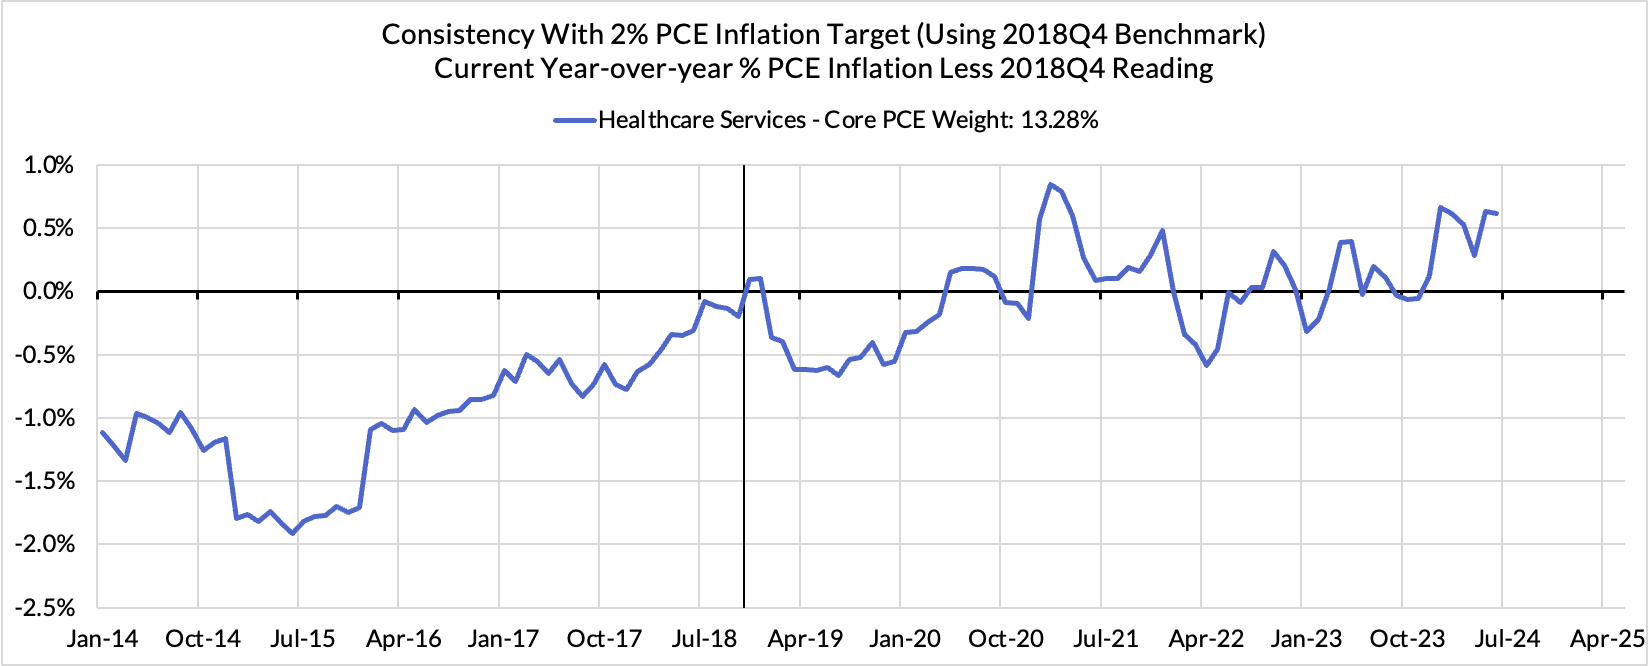
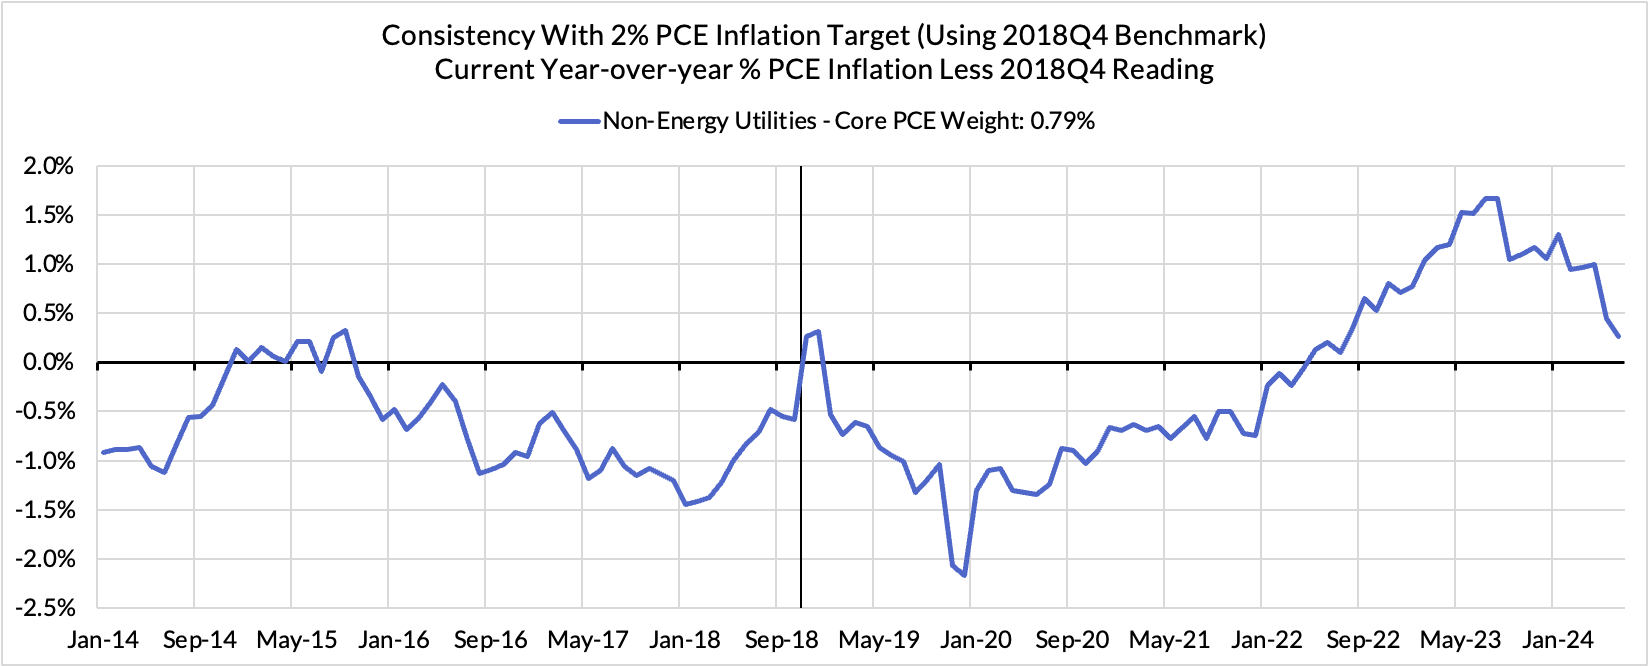
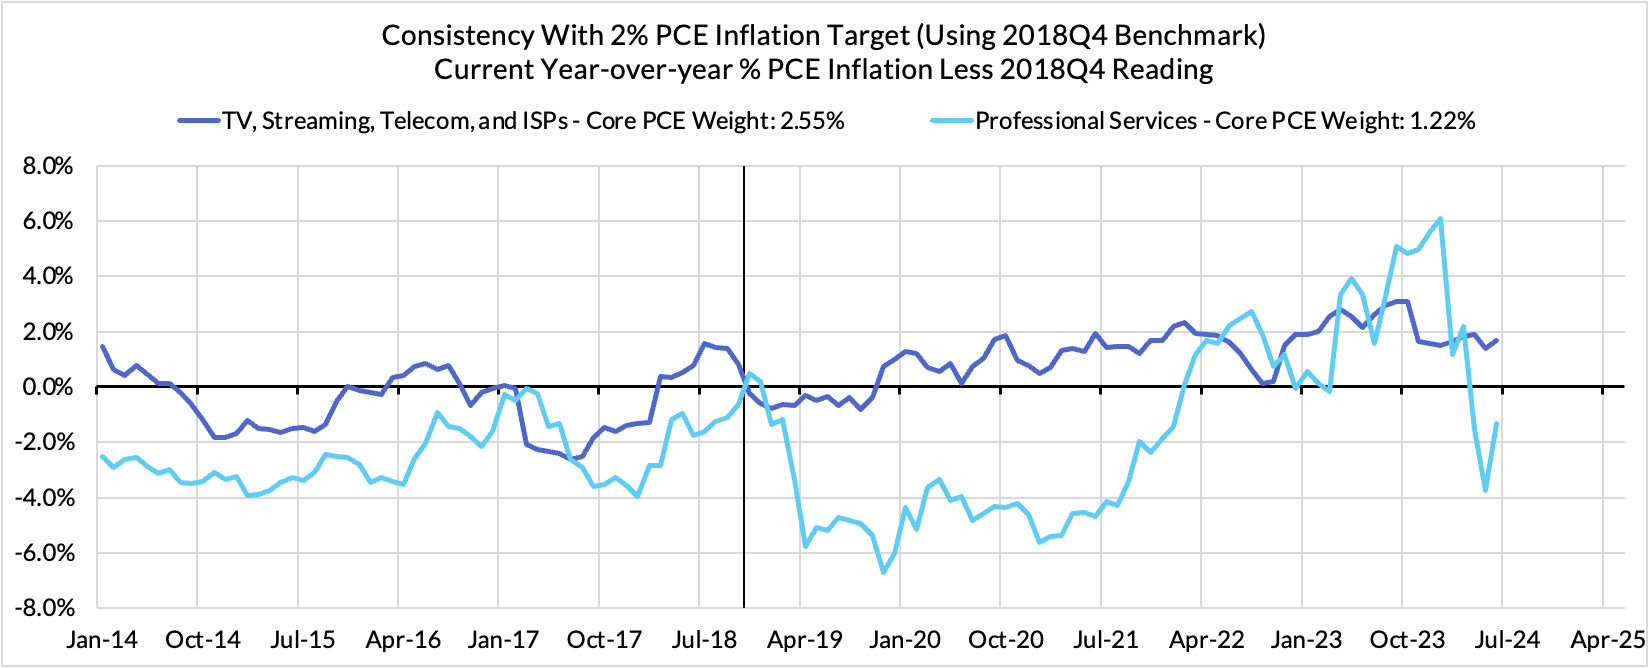
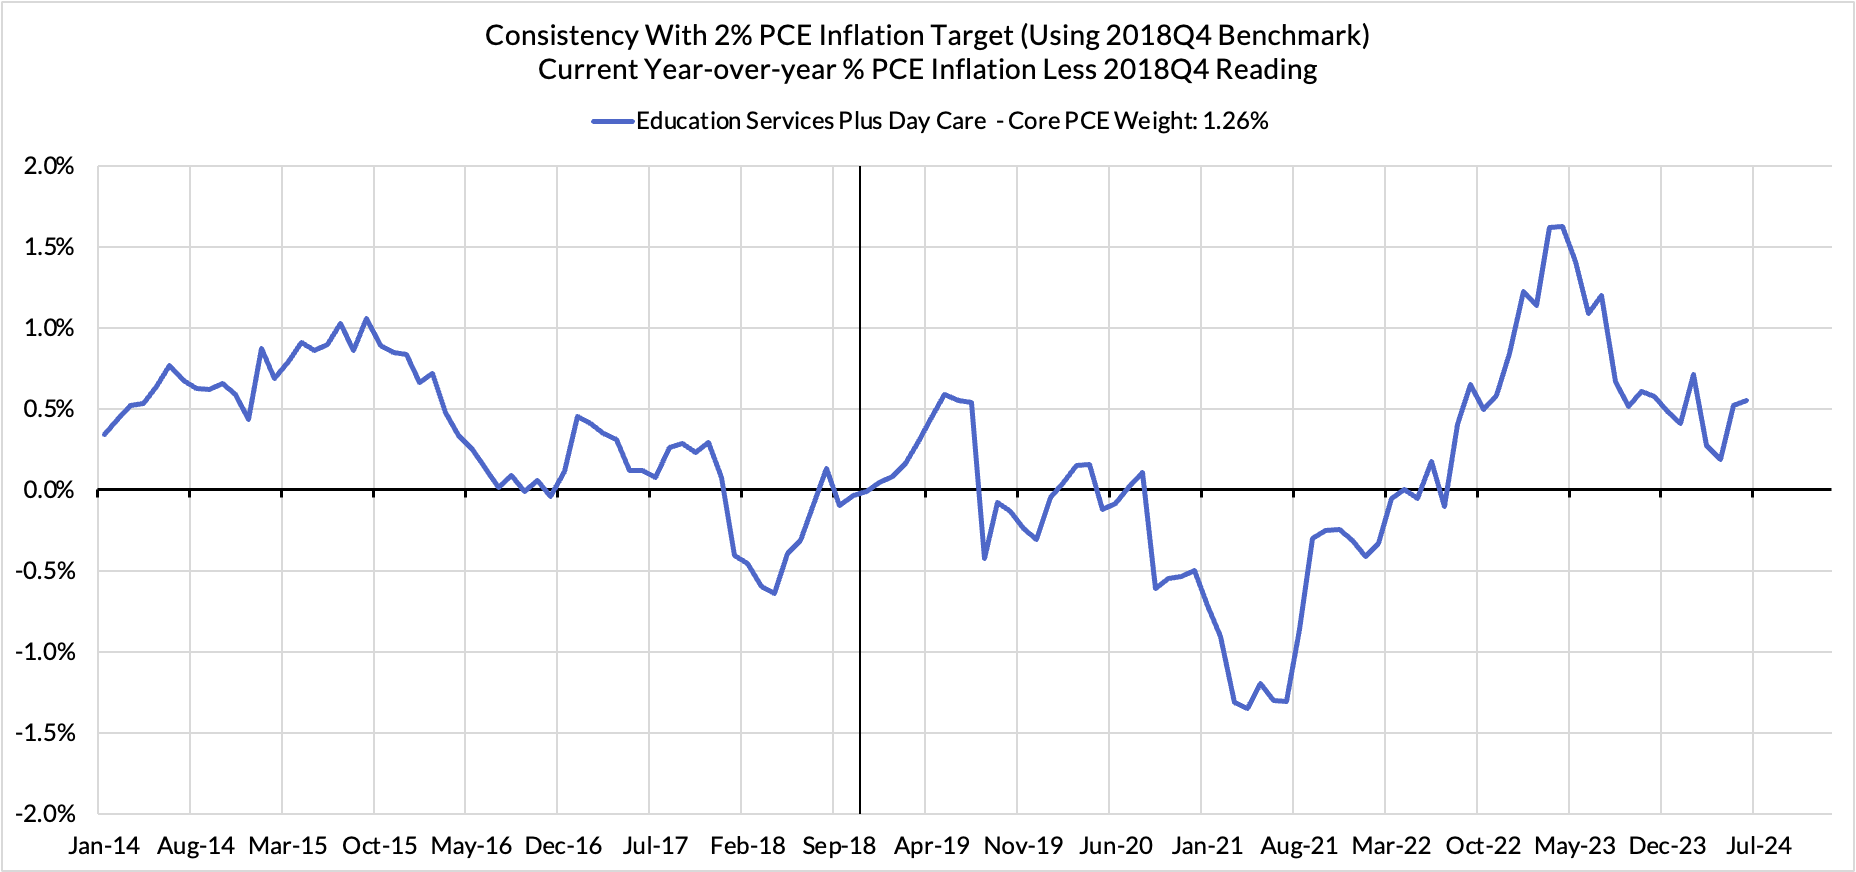
PCE Charts
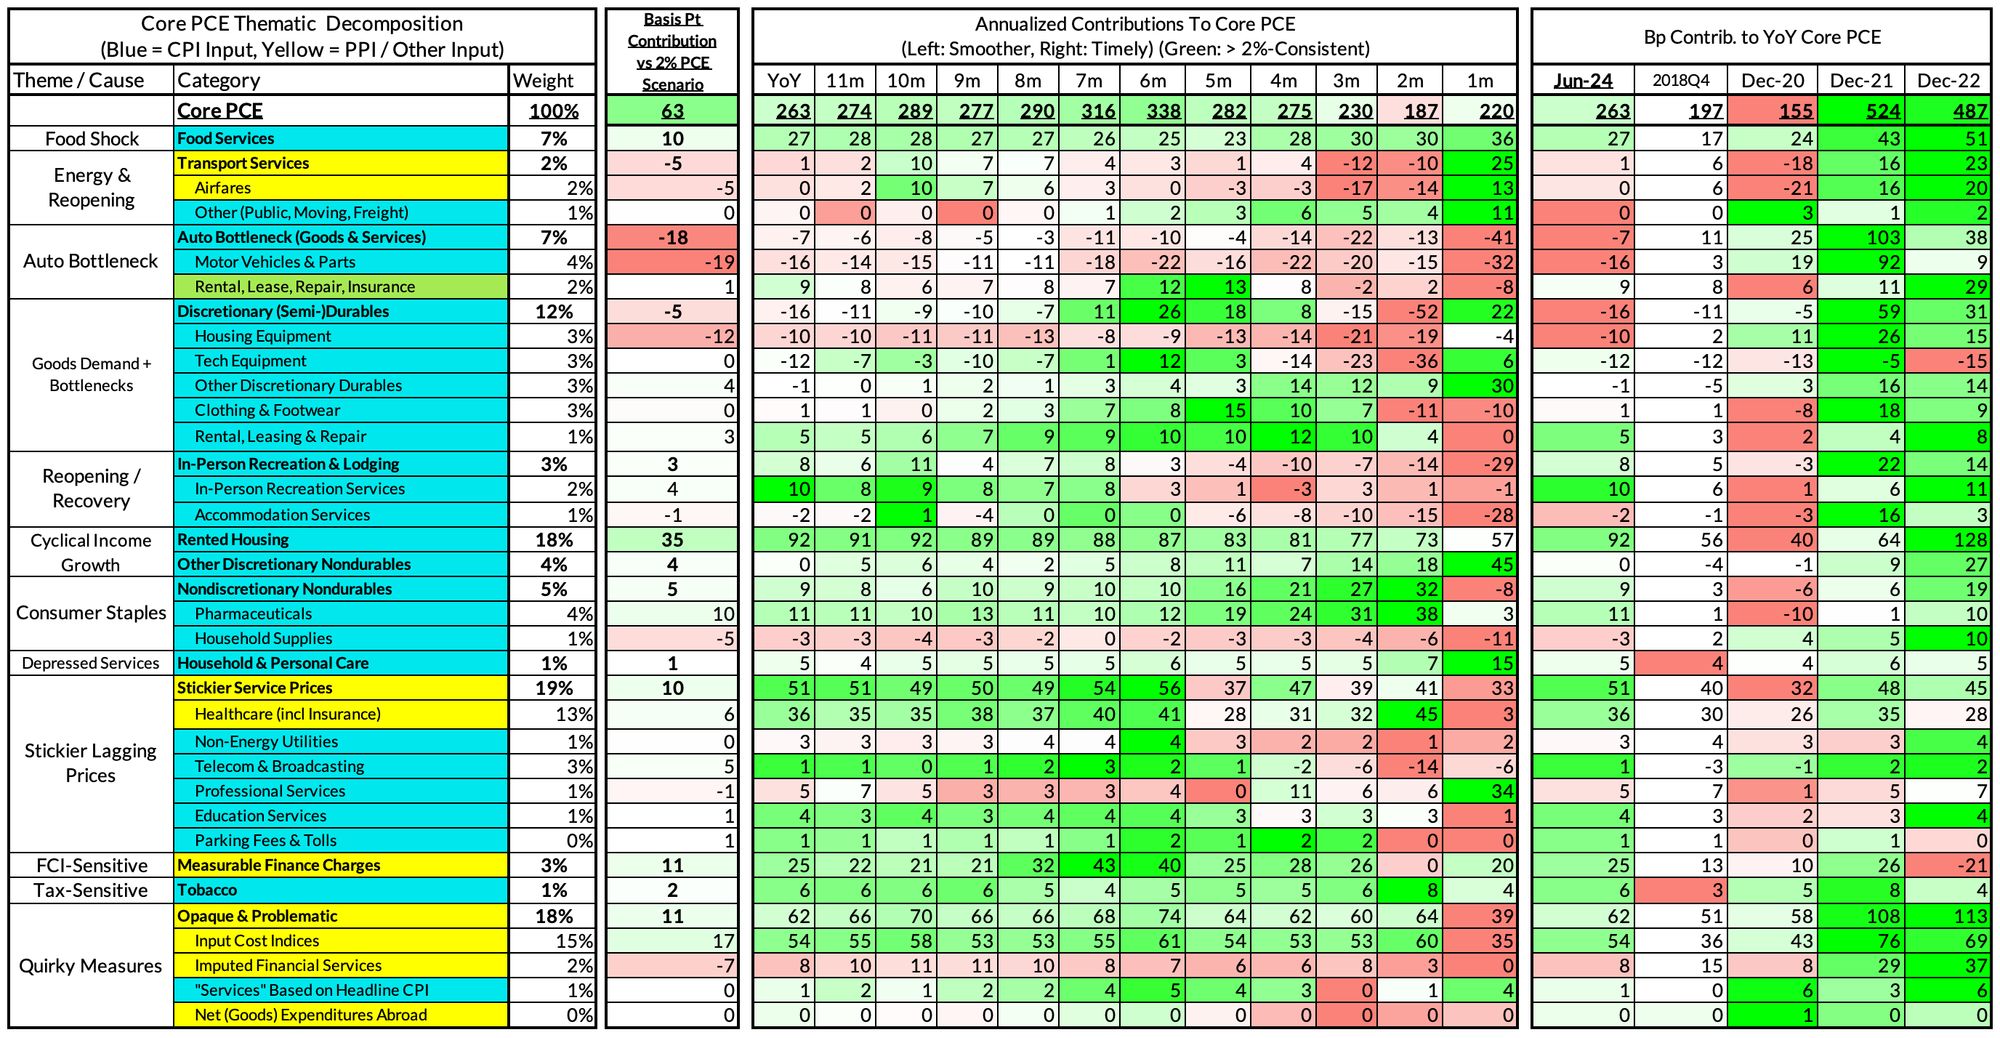
For the Detail-Oriented: Core PCE Heatmaps
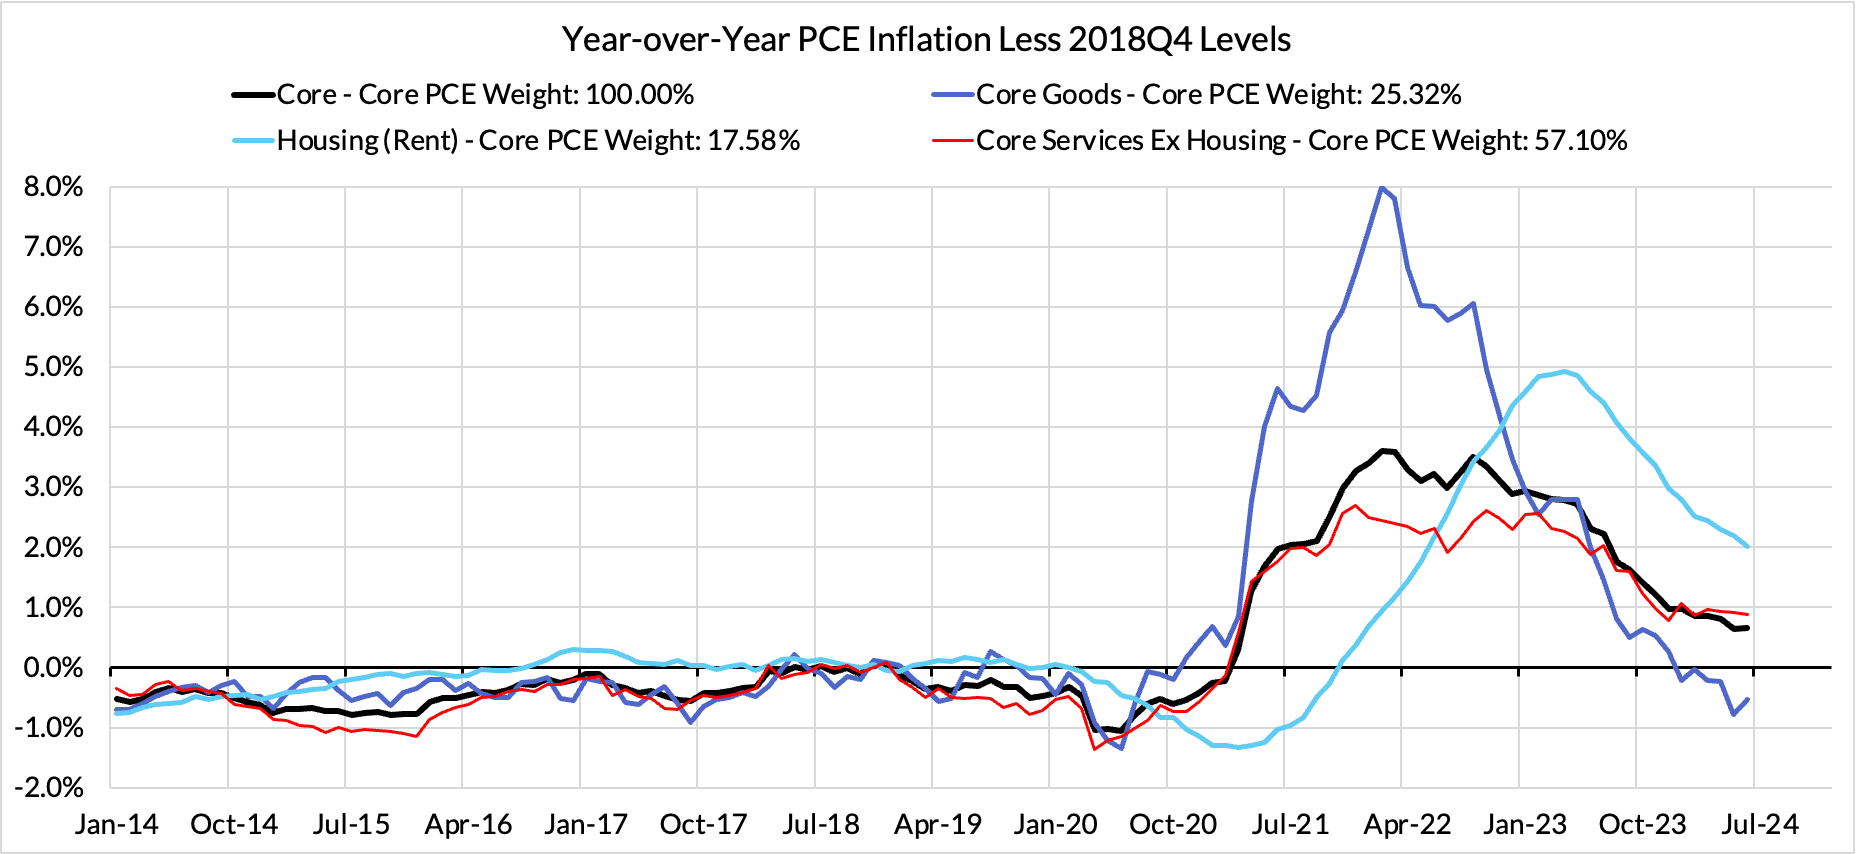
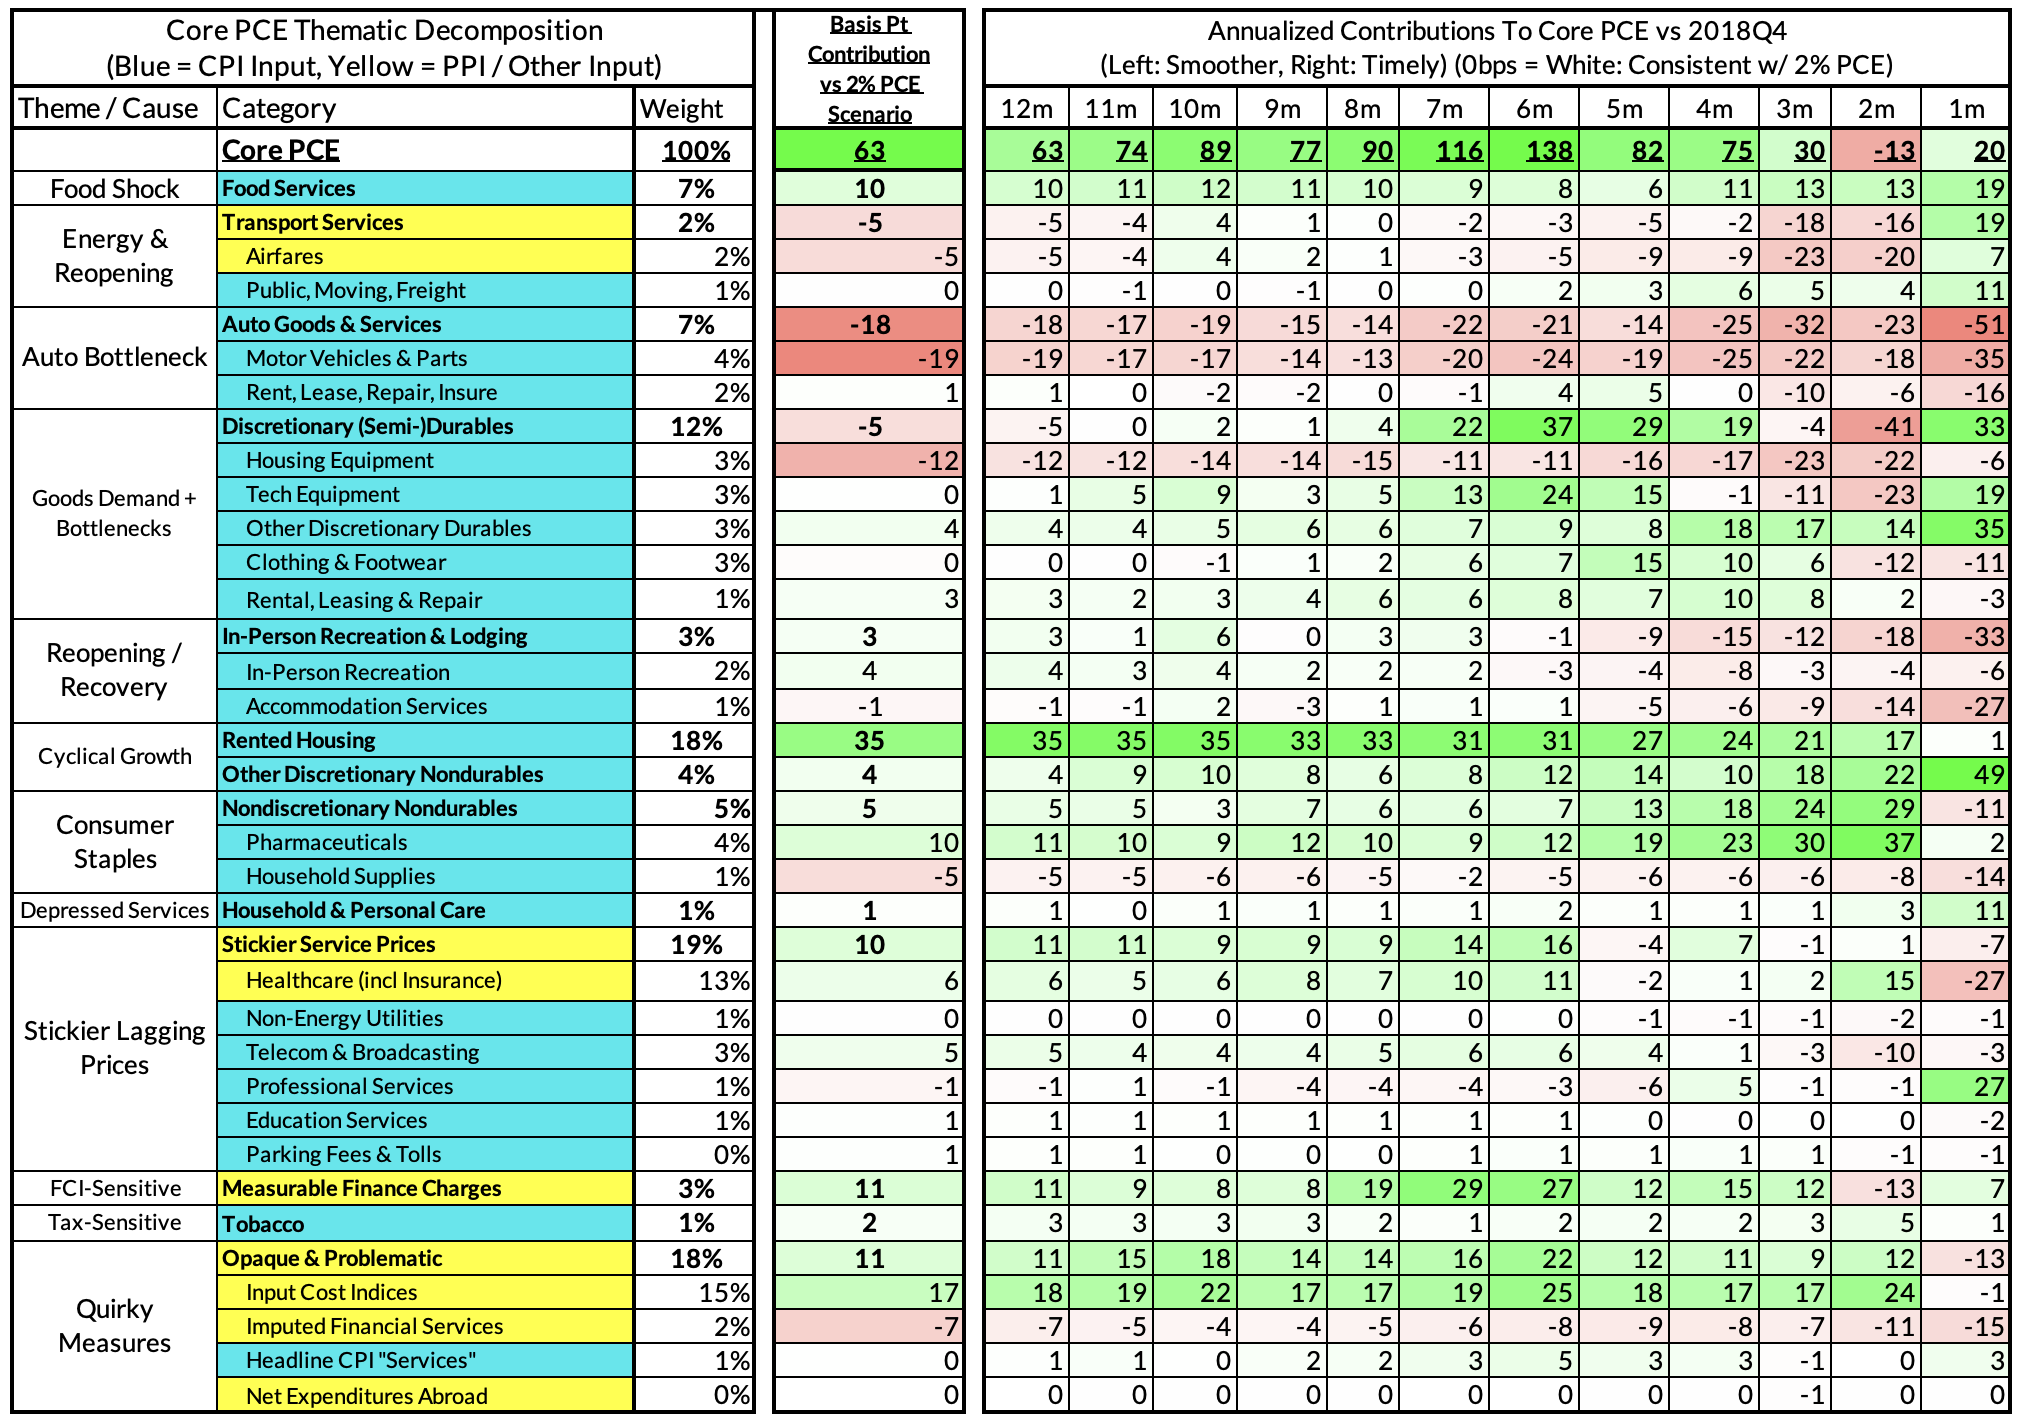
Right now Core PCE (PCE less food products and energy) is running at a 2.63% year-over-year pace as of June, 63 basis points above the Fed's 2% inflation target for PCE. That projected overshoot is disproportionately driven by catch-up rent CPI inflation in response to the surge in household formation (a byproduct of rapidly recovering job growth) and market rents in 2021-22. Rent is on track to contribute 35 basis points to the 63 basis point Core PCE overshoot.
There are other contributors to the overshoot:
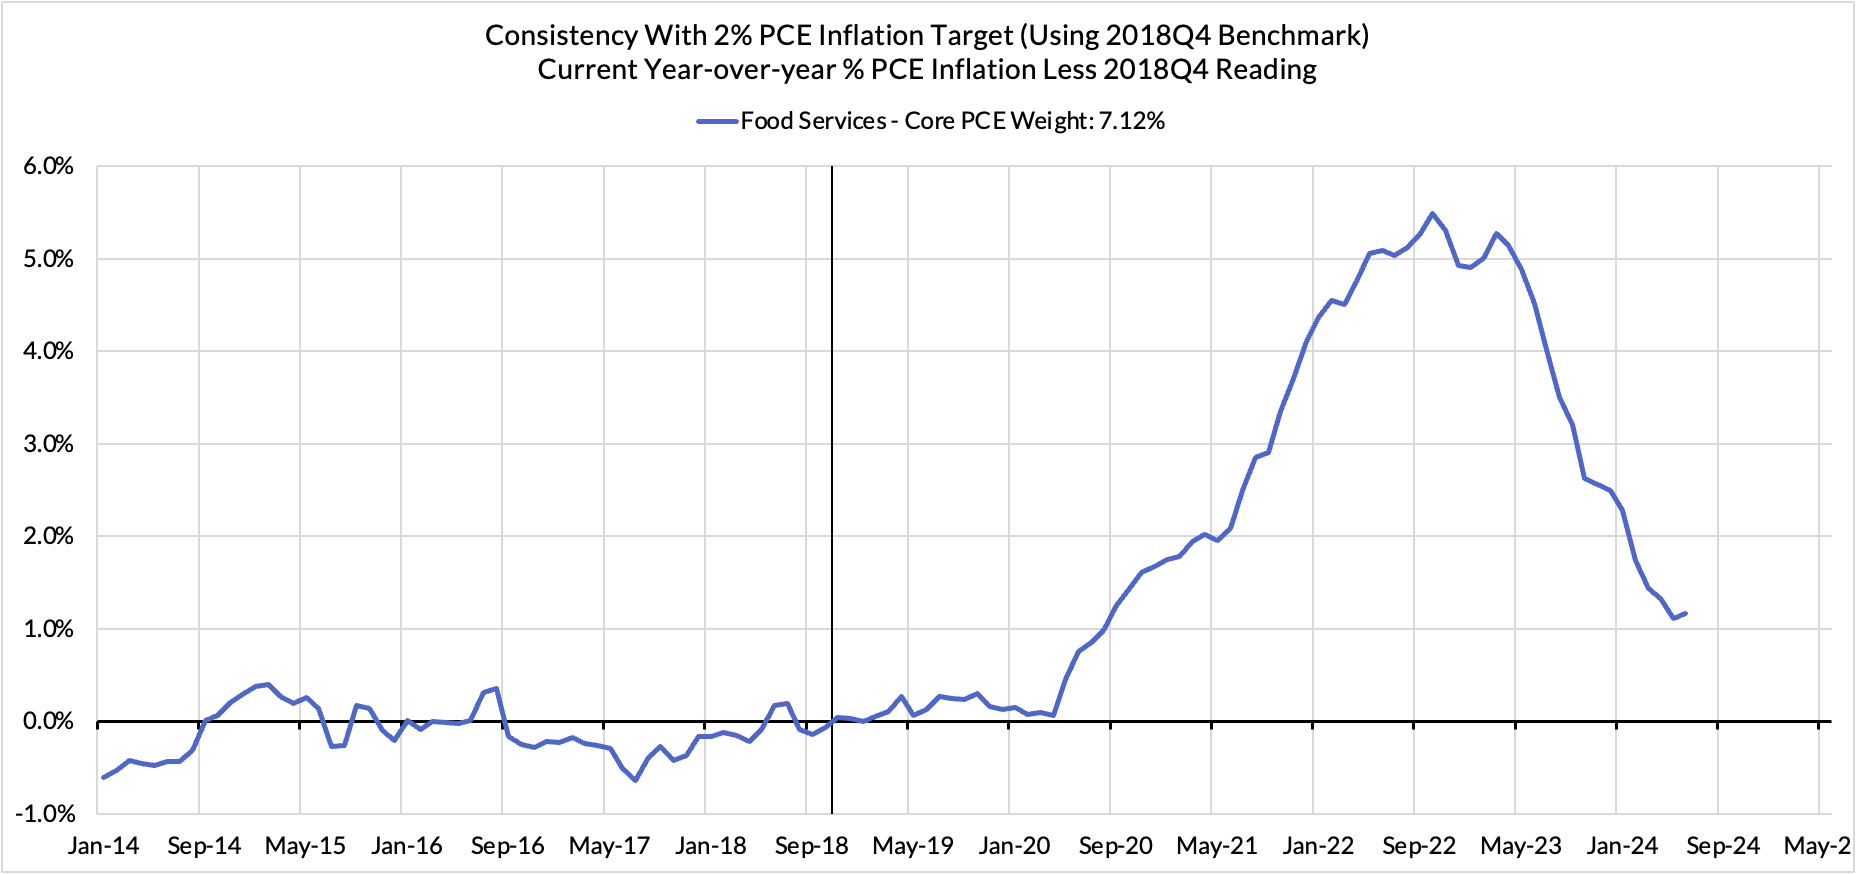
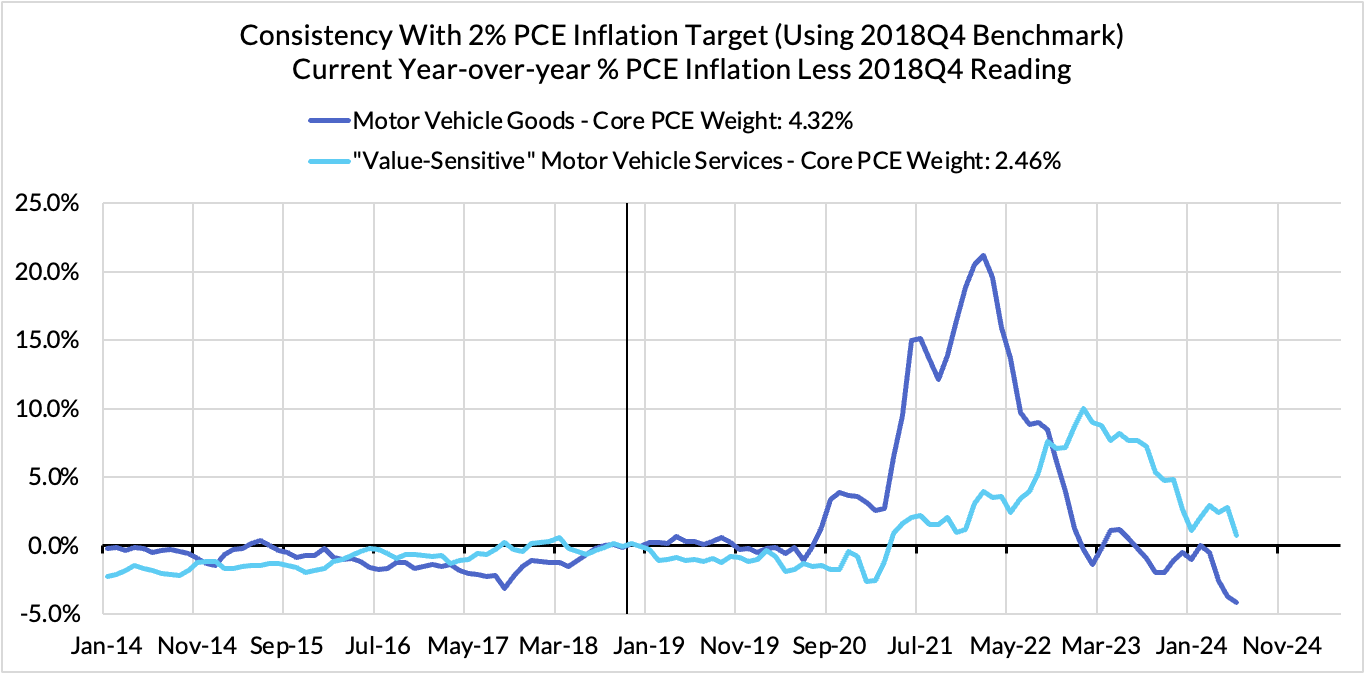
Some more supply-driven (food inputs likely adding 10 basis points to the overshoot, unwinding motor vehicle bottlenecks now likely subtracting 18 basis points after being a substantial contributor)
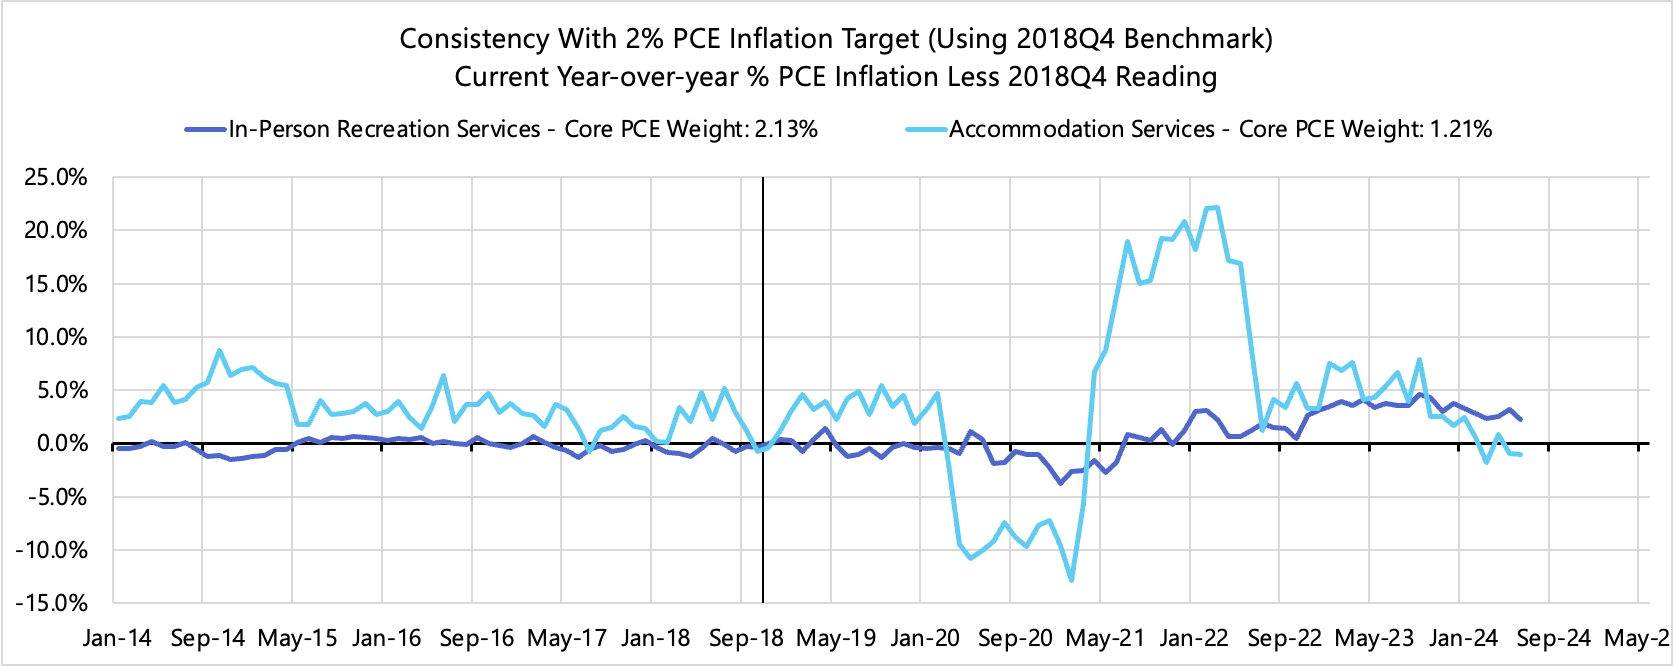
Some more demand-driven (in-person recreation and lodging services likely adding 3 basis points to the overshoot)
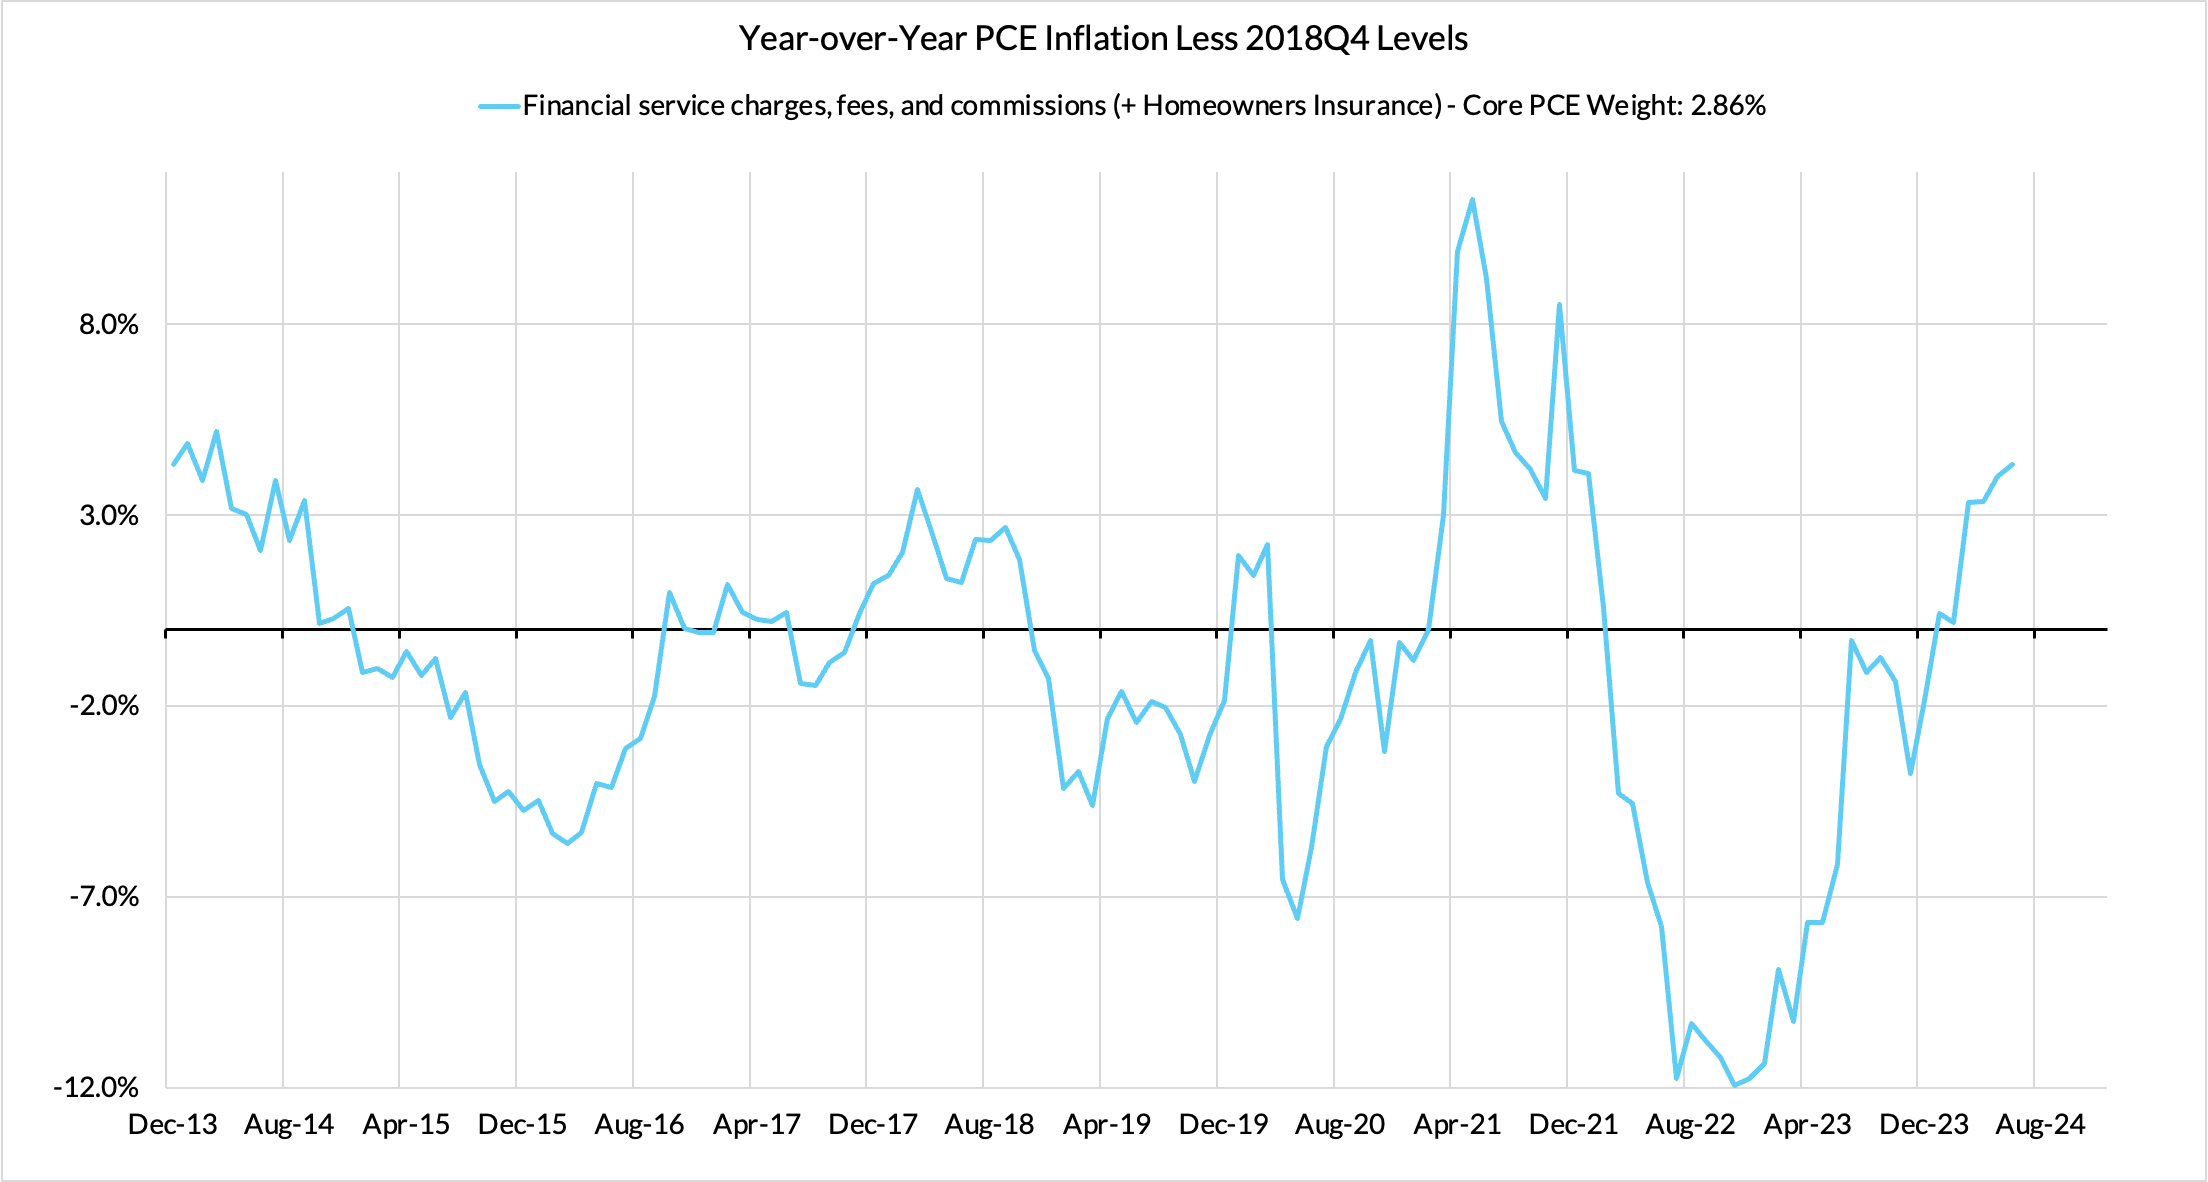
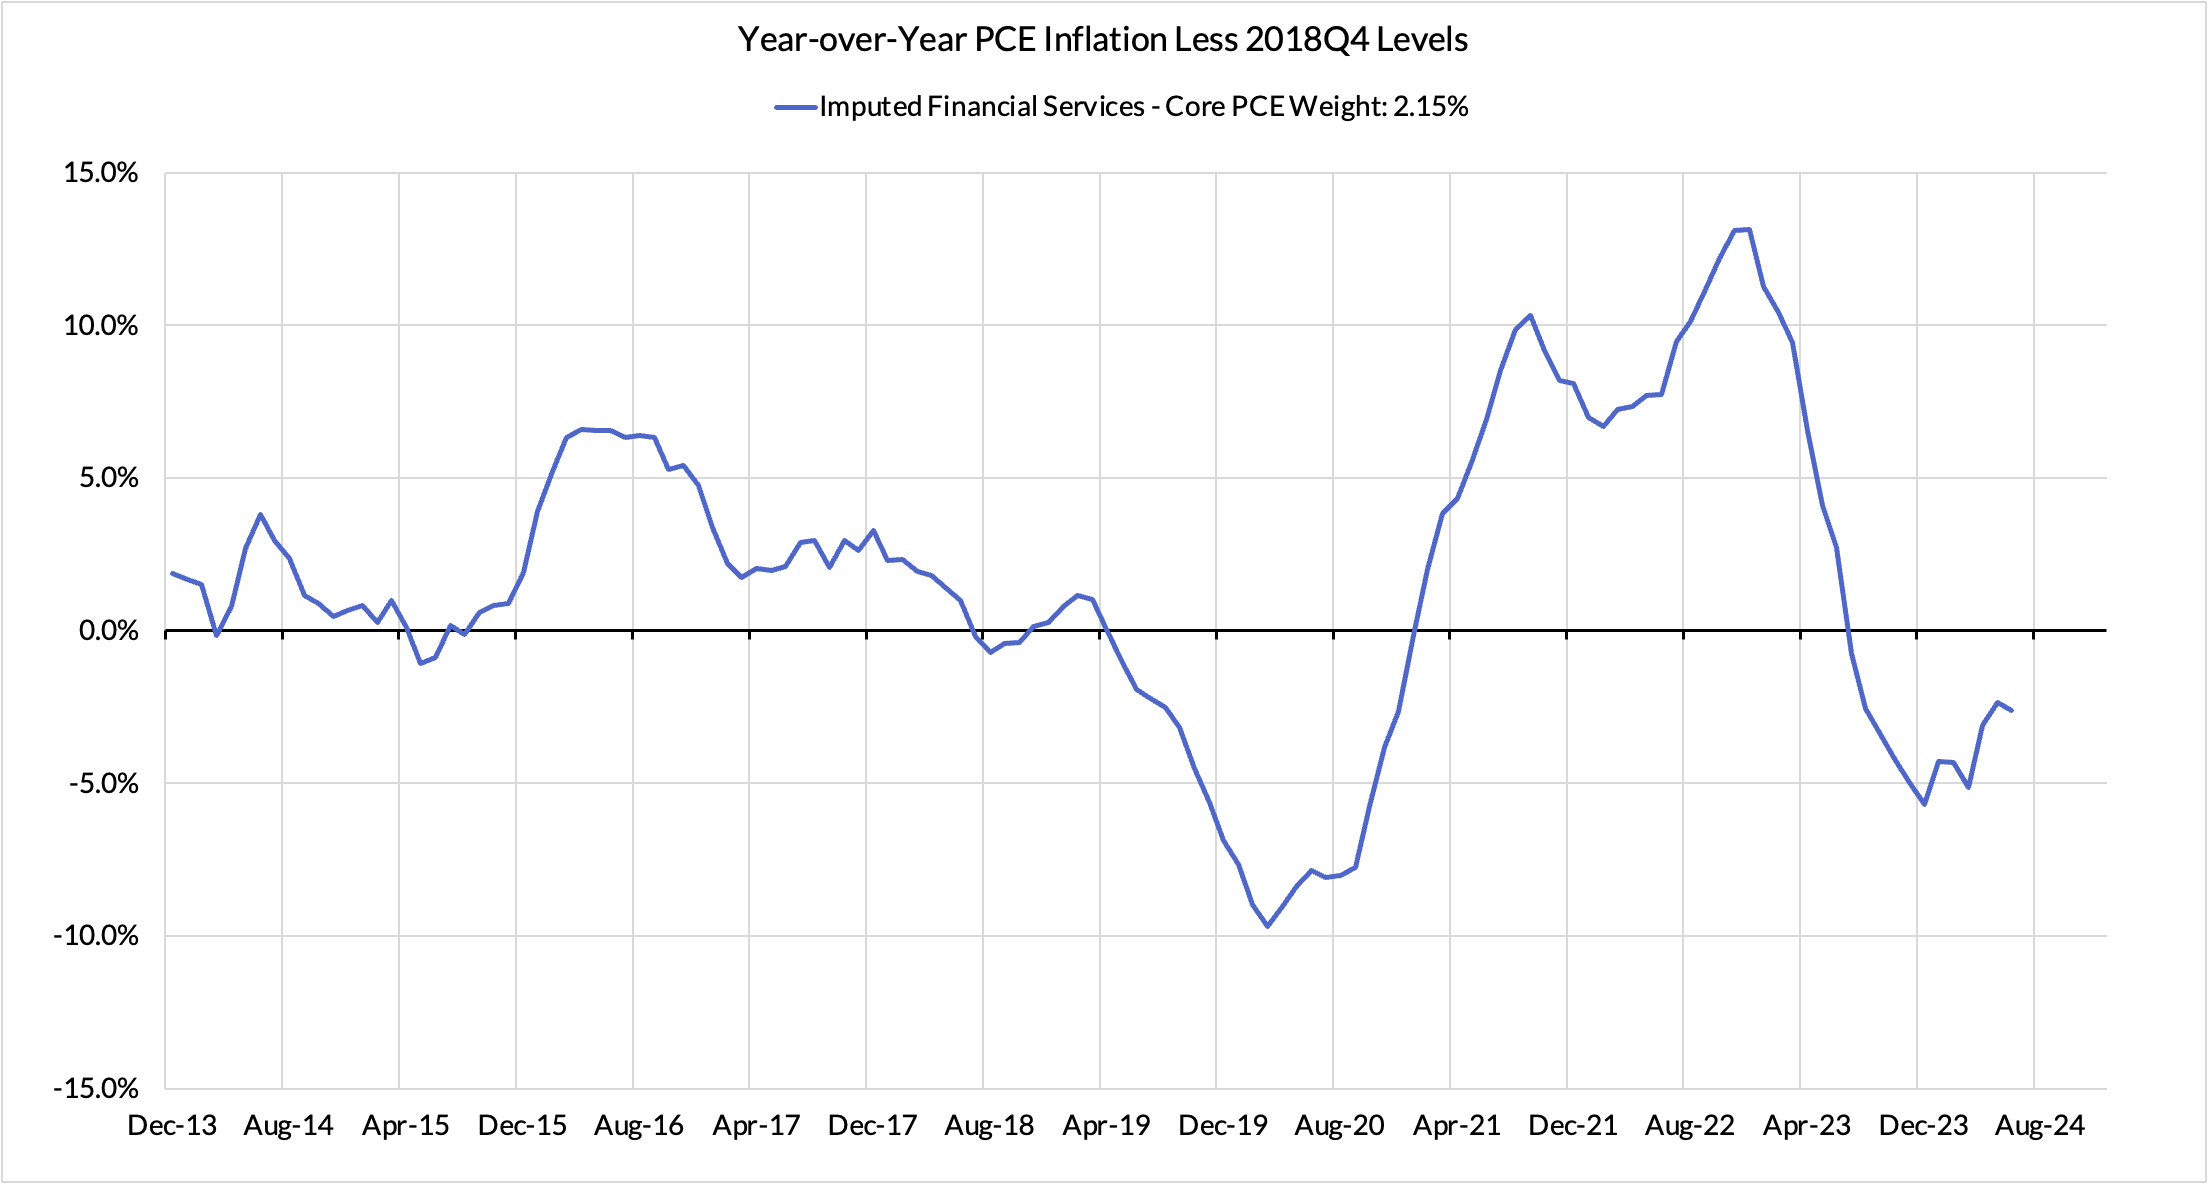
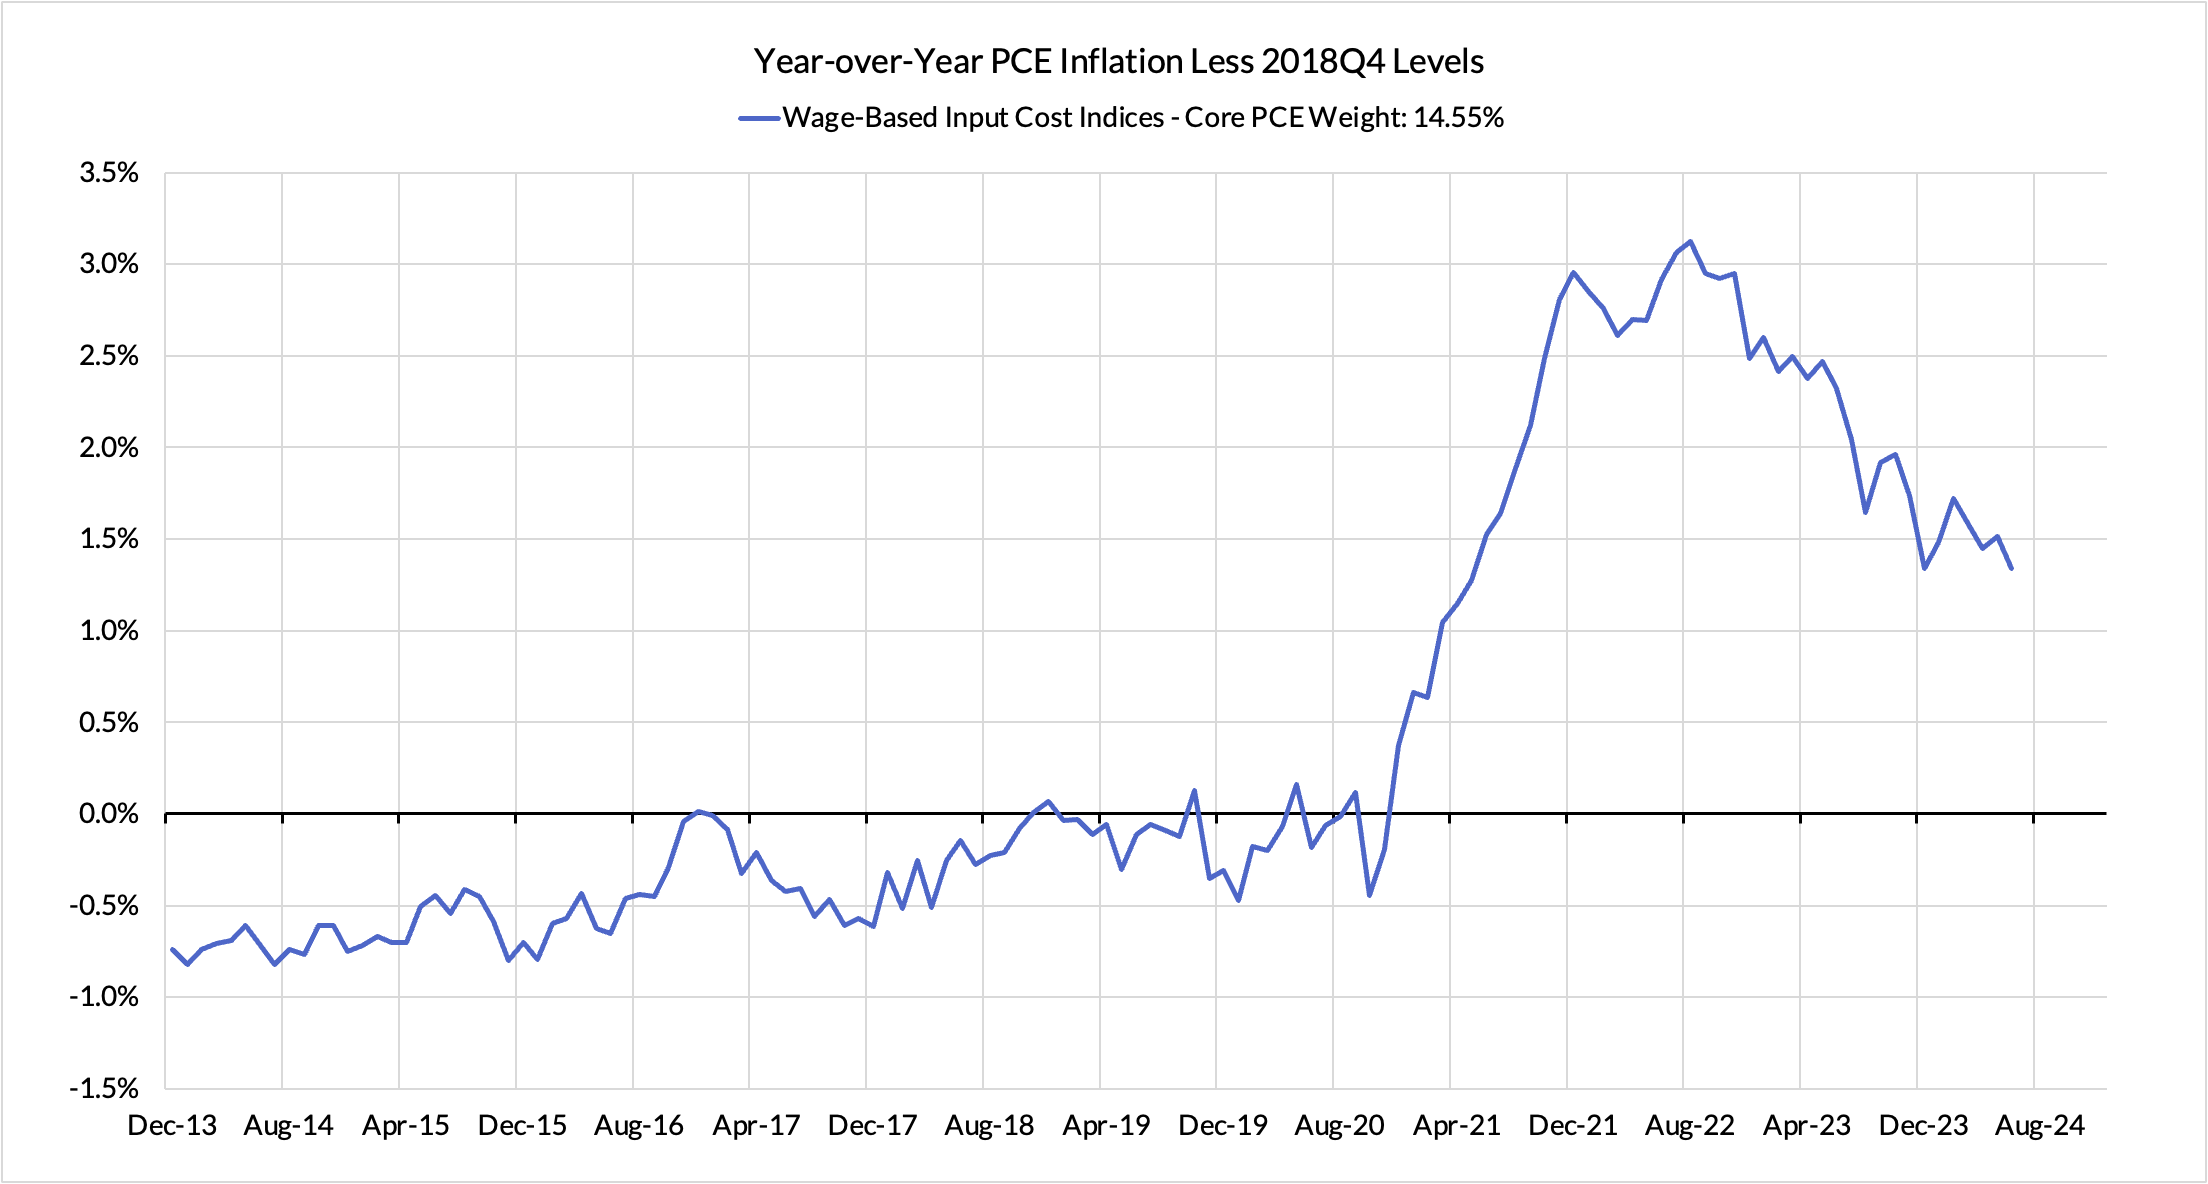
Some oddball segments have offsetting effects (measured financial service charges now likely adding 11 basis points, while contributions from input cost indices and imputed financial services likely adding 10 basis points to Core PCE vs 2%-consistent outcomes).
The final heatmap below gives you a sense of the overshoot on shorter annualized run-rates. June monthly annualized Core PCE ran at a 2.20% annualized pace, a 20 basis point overshoot vs 2% target inflation.
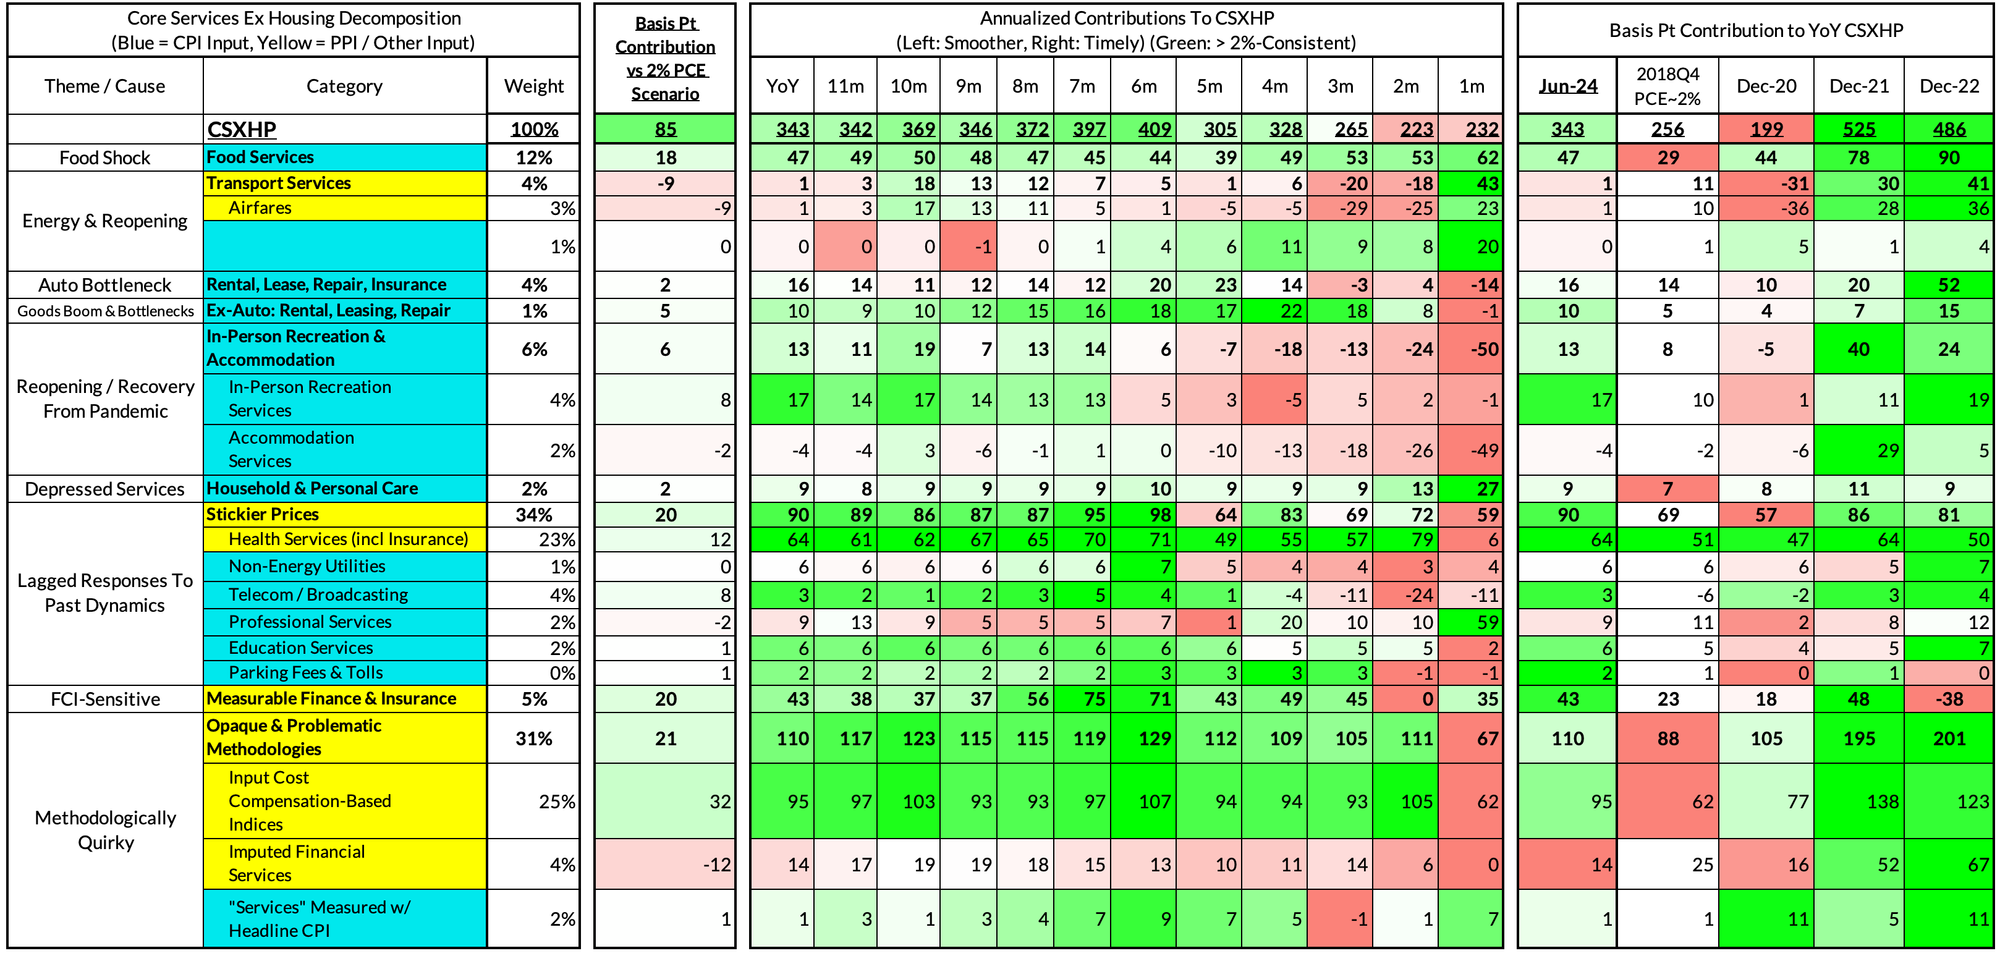
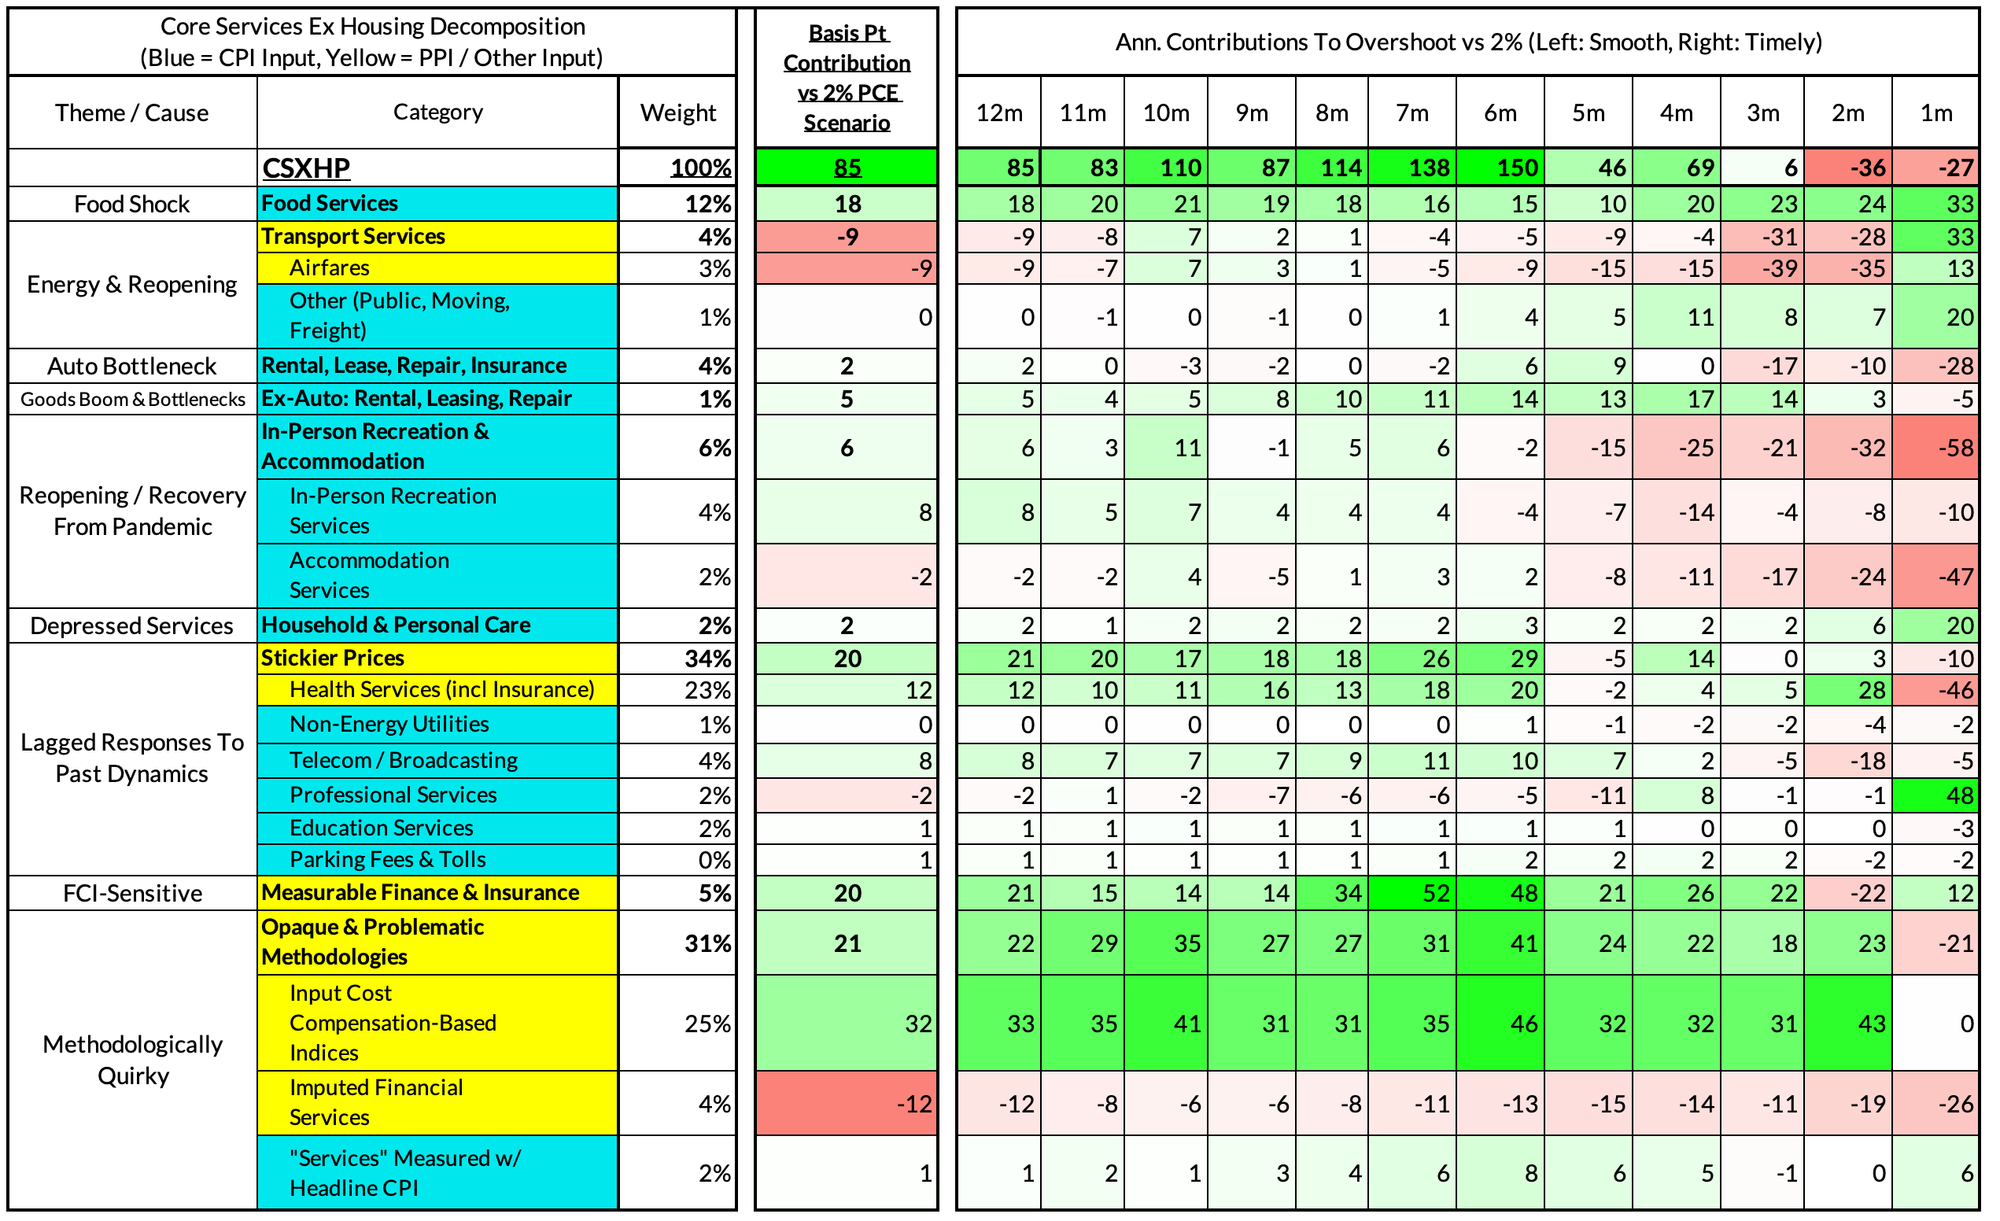
For the Detail-Oriented: Core Services Ex Housing PCE Heatmaps
The June growth rate in "Core Services Ex Housing" ('Supercore') PCE is running at 3.43% year-over-year, an 85 basis point overshoot versus the ~2.59% run rate that coincided with ~2% headline and Core PCE.
June monthly supercore ran at a 2.32% annualized rate, a 27 basis point annualized undershoot of what would be consistent with 2% Headline and Core PCE.
The link has been copied!
Your link has expired. Please request a new one.
Your link has expired. Please request a new one.
Your link has expired. Please request a new one.
Great! You've successfully signed up.
Great! You've successfully signed up.
Welcome back! You've successfully signed in.
Success! You now have access to additional content.