Most of the Personal Consumption Expenditures (PCE) inflation gauges are sourced from Consumer Price Index (CPI) data, but Producer Price Index (PPI) input data is of increasing relevance, import price index (IPI) data can prove occasionally relevant. There are also some high-leverage components that only come out on the days of the GDP and PCE releases.
If you'd like to start a 90-day free trial of our exclusive content, you can do so using this link. If you have any questions or would like to see samples of our past content, feel free to get in touch with us.
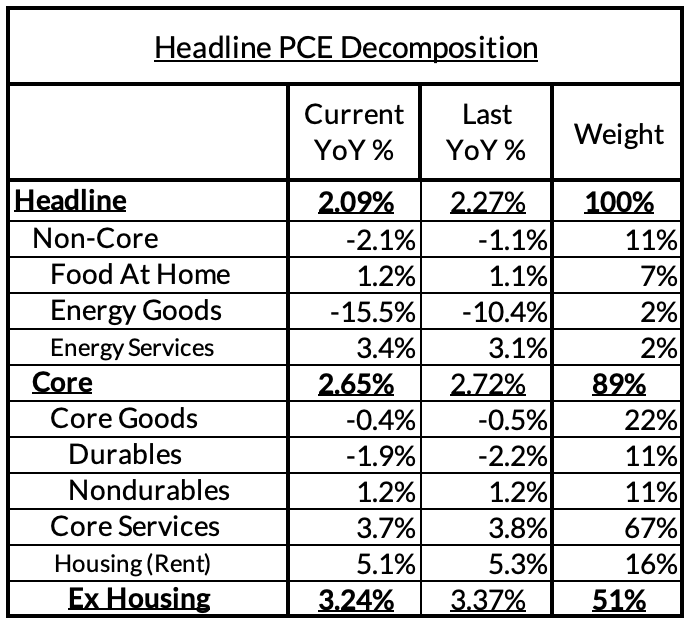

Summary: PCE Nowcasts
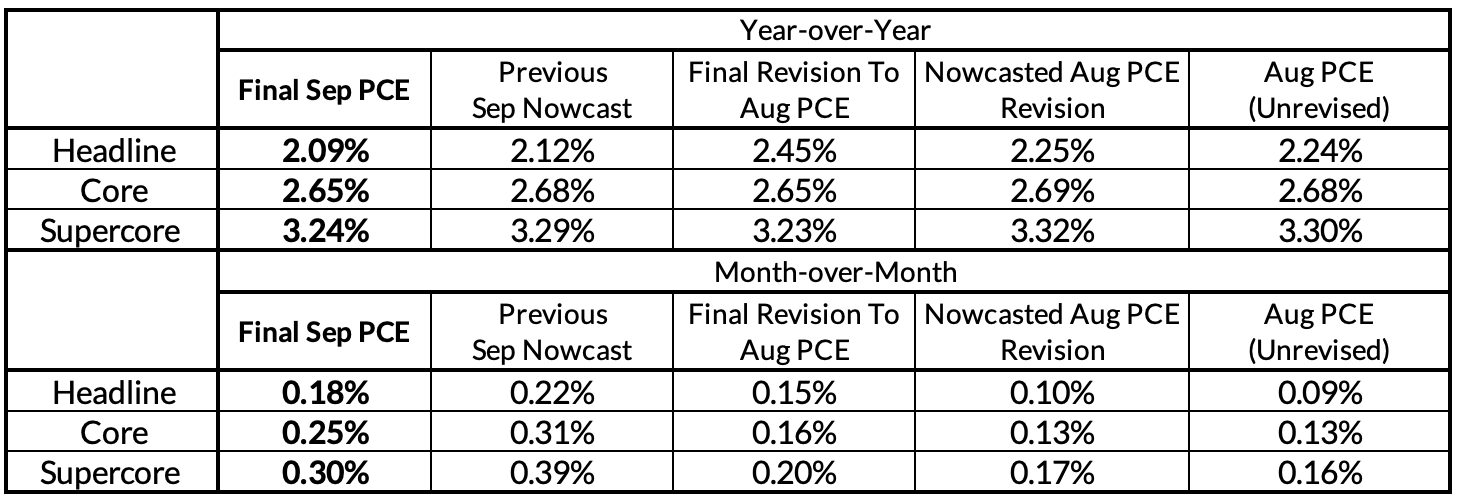
September ended up being one of our bigger errors on the Core PCE Nowcast (we've typically been within 3bps on m/m & y/y). Year-over-year Core PCE was indeed just 3bps lower than what we projected, but our estimates of the allocation of upside was relatively off the mark. We anticipated more of the upside would be focused in September, when we ideally should have baked more upside via revisions.
Even with this downside surprise relative to our nowcast, September Core PCE still looks firm. Given the run in the equity market in September, there are already some upside dynamics that will filter into Core and Supercore PCE in October. Today's data and ECI reading shade us only marginally back in favor of expecting a 25 basis point cut at the December meeting (as opposed to a pause).
While the labor market itself is far from inflationary, the Fed is still liable to getting headfaked by non-labor dynamics relevant to monthly and quarterly inflation readings. A December cut is likely to rest on either seeing further signs of disinflation to round out the year, or else additional deterioration in labor or financial markets (not attributable to hurricanes alone).
Inflation Overshoots At The Component Level


For the Detail-Oriented: Core PCE Heatmaps
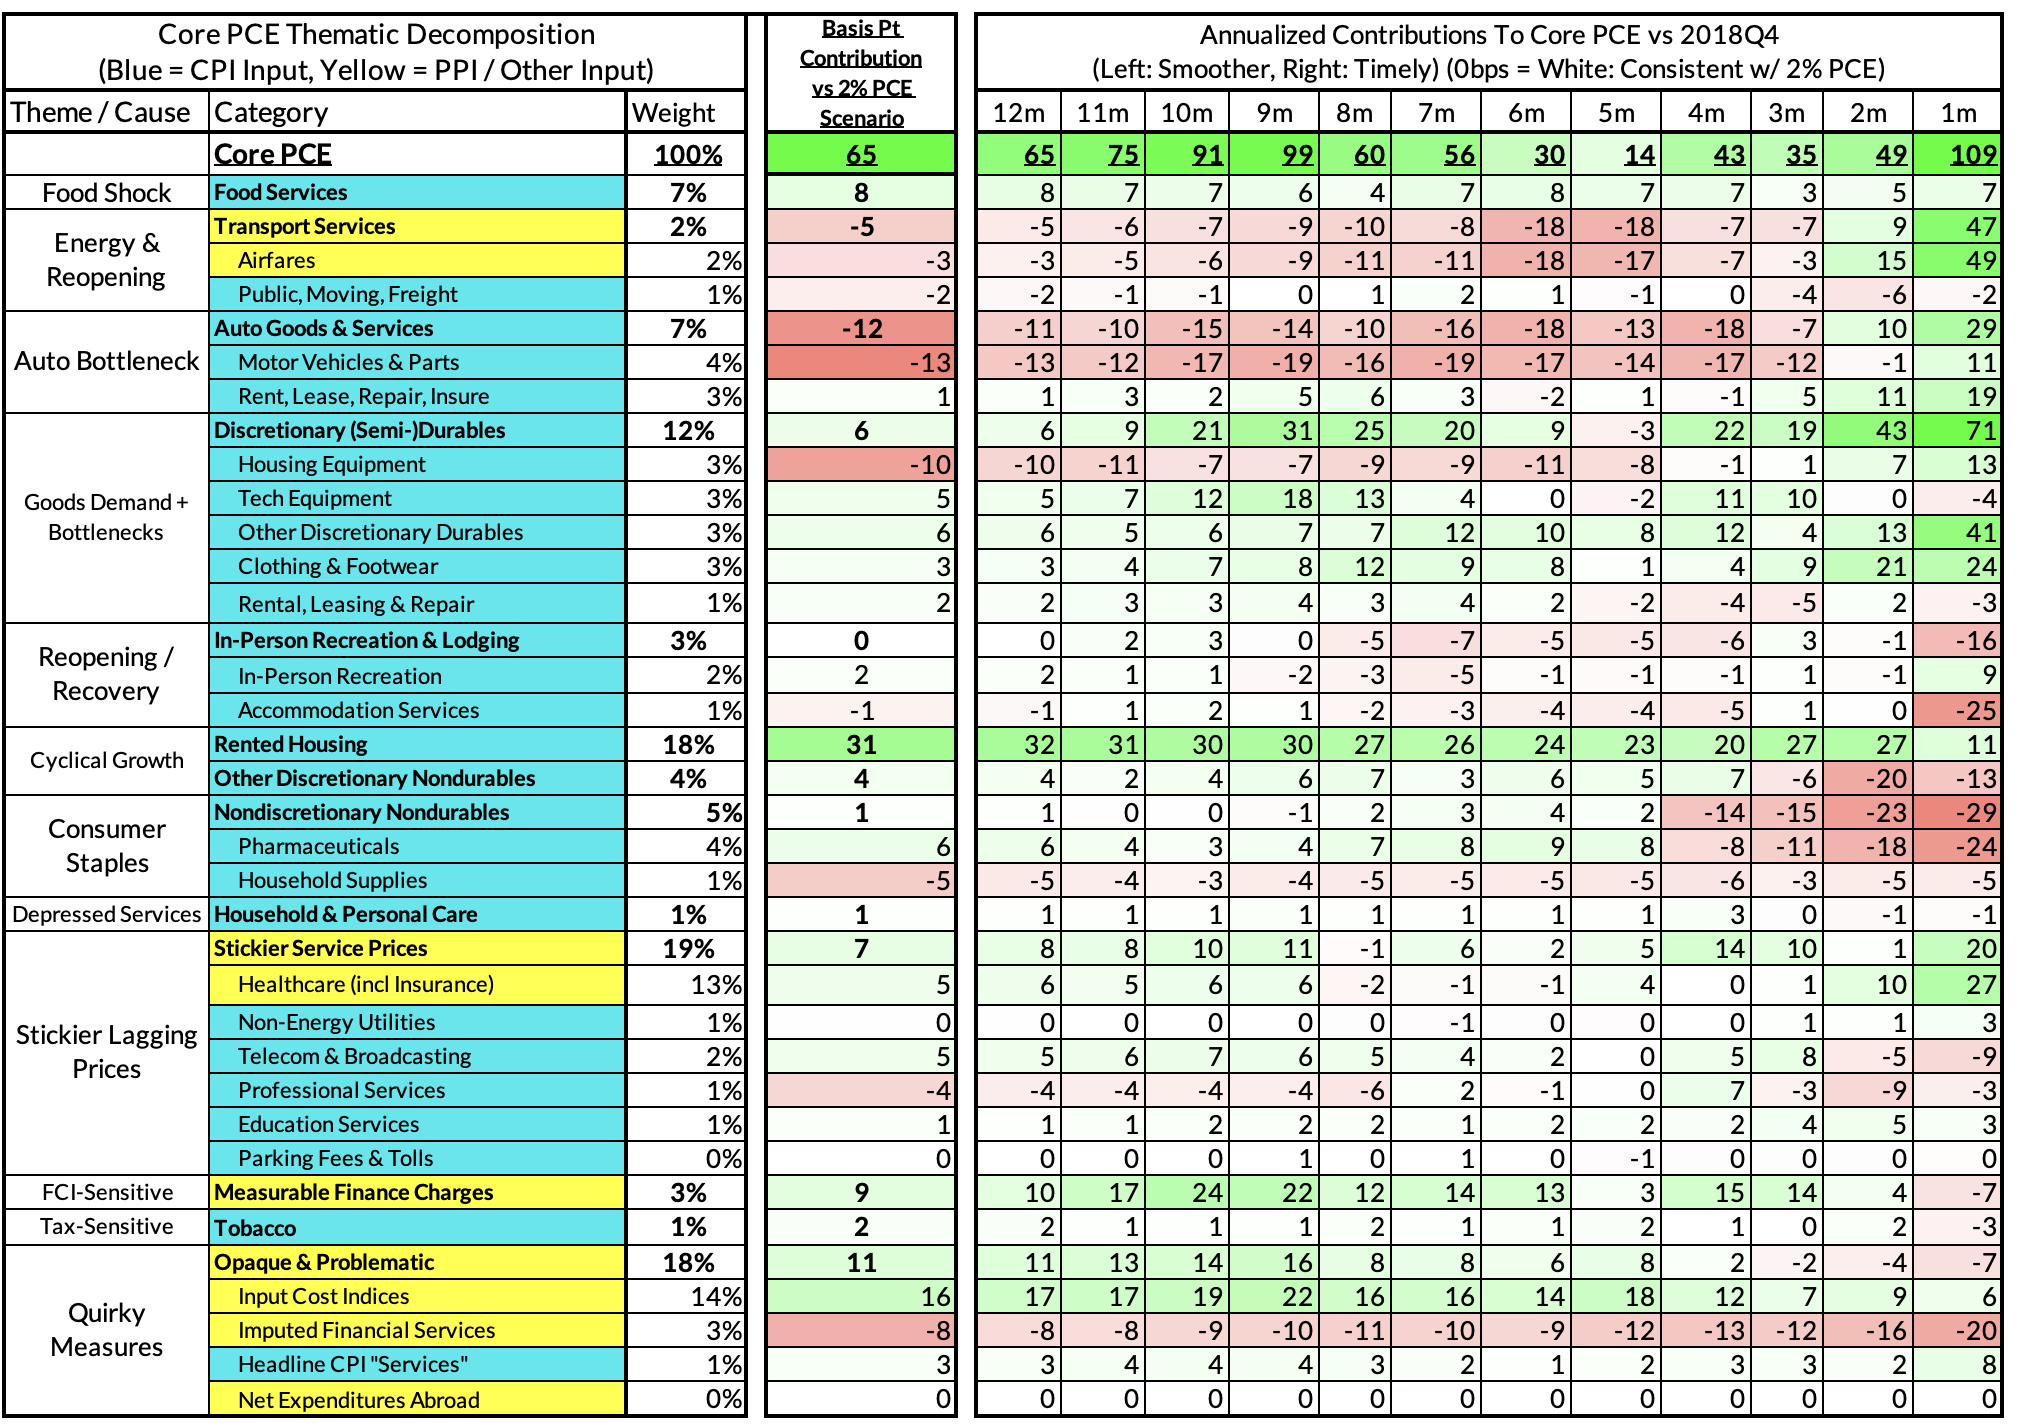
Right now Core PCE (PCE less food products and energy) is running at a 2.65% year-over-year pace as of September, 65 basis points above the Fed's 2% inflation target for PCE. That projected overshoot is disproportionately driven by catch-up rent CPI inflation in response to the surge in household formation (a byproduct of rapidly recovering job growth) and market rents in 2021-22. Rent is on track to contribute 31 basis points to the 65 basis point Core PCE overshoot.
There are other contributors to the overshoot:
- Some more supply-driven (food inputs likely adding 8 basis points to the overshoot, unwinding motor vehicle bottlenecks now likely subtracting 12 basis points after being a substantial contributor)
- Some more demand-driven (in-person recreation services likely adding 2 basis points to the overshoot)
Some oddball segments have offsetting effects (measured financial service charges now likely adding 11 basis points, while contributions from input cost indices and imputed financial services likely adding 8 basis points to Core PCE vs 2%-consistent outcomes).
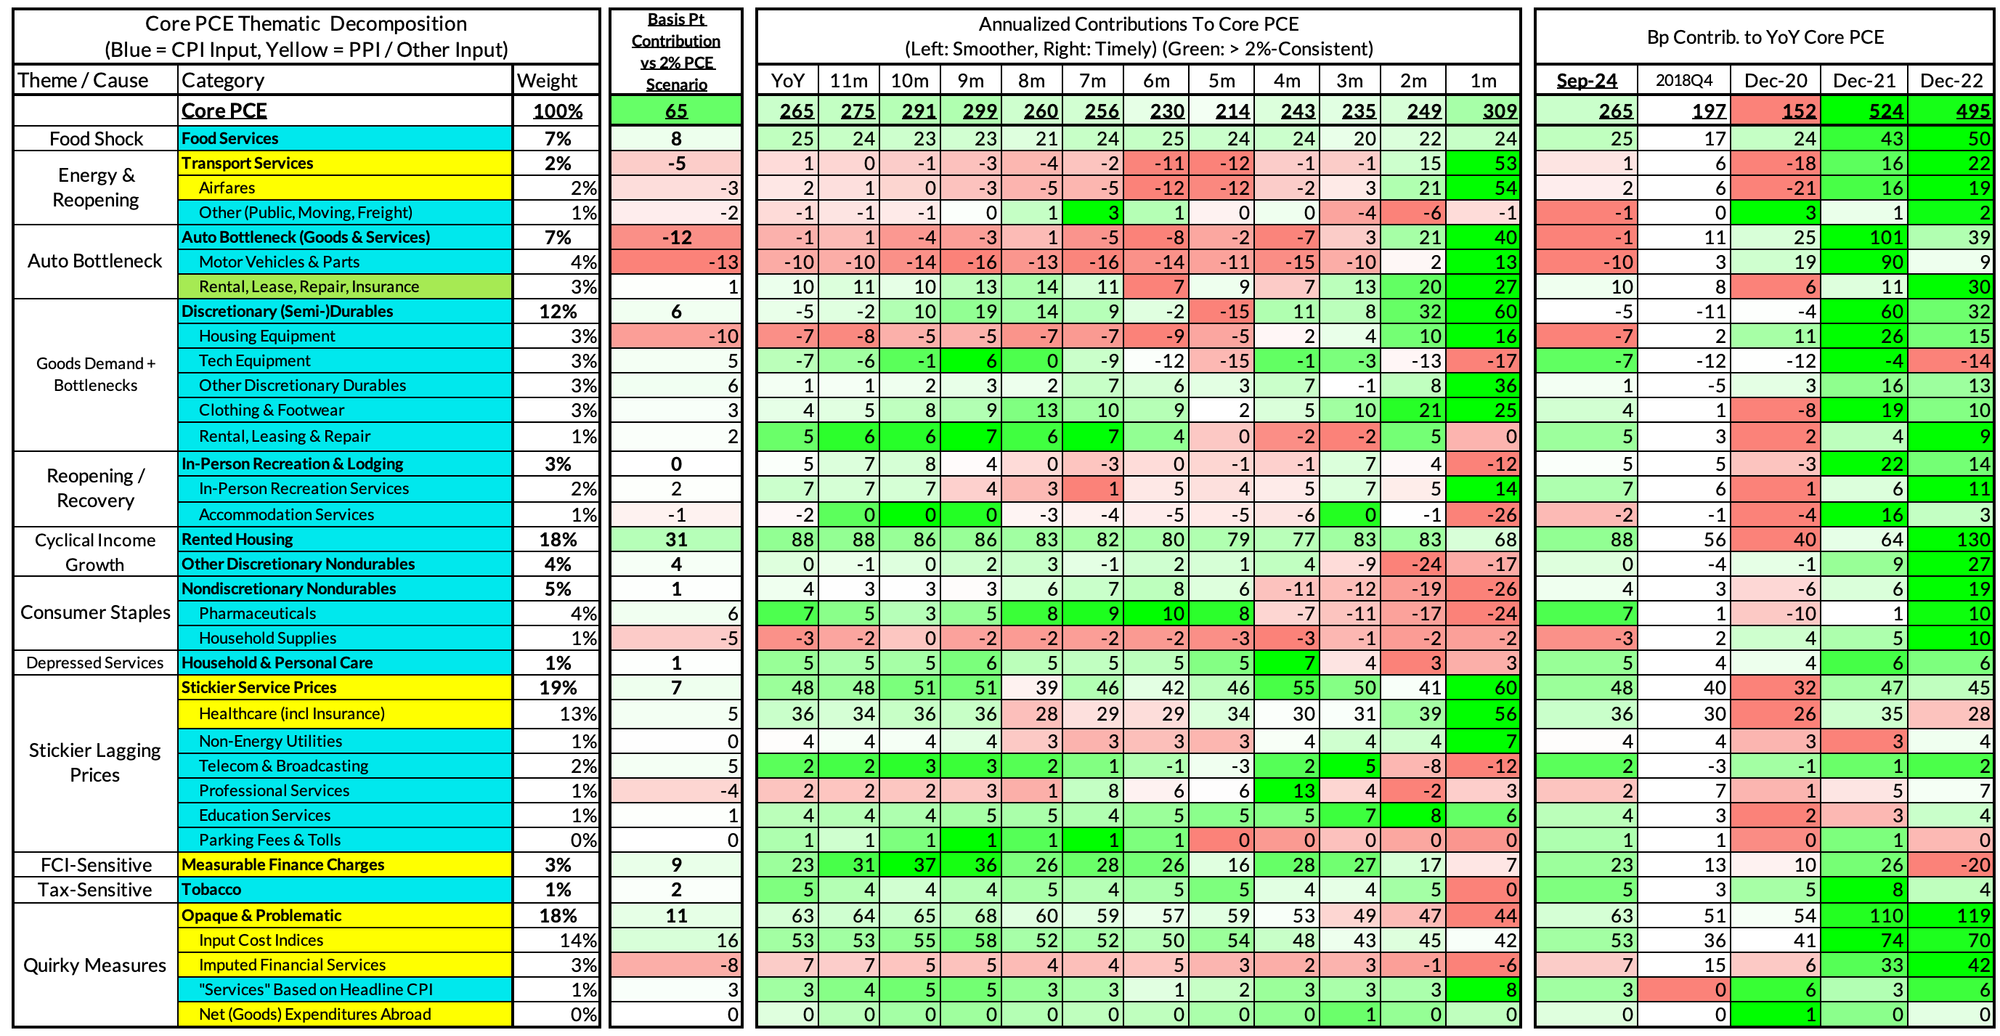
The subsequent heatmap below gives you a sense of the overshoot on shorter annualized run-rates. September monthly annualized Core PCE ran at a 3.09% annualized pace, a 109bp overshoot vs 2% target inflation.
For the Detail-Oriented: Core Services Ex Housing PCE Heatmaps
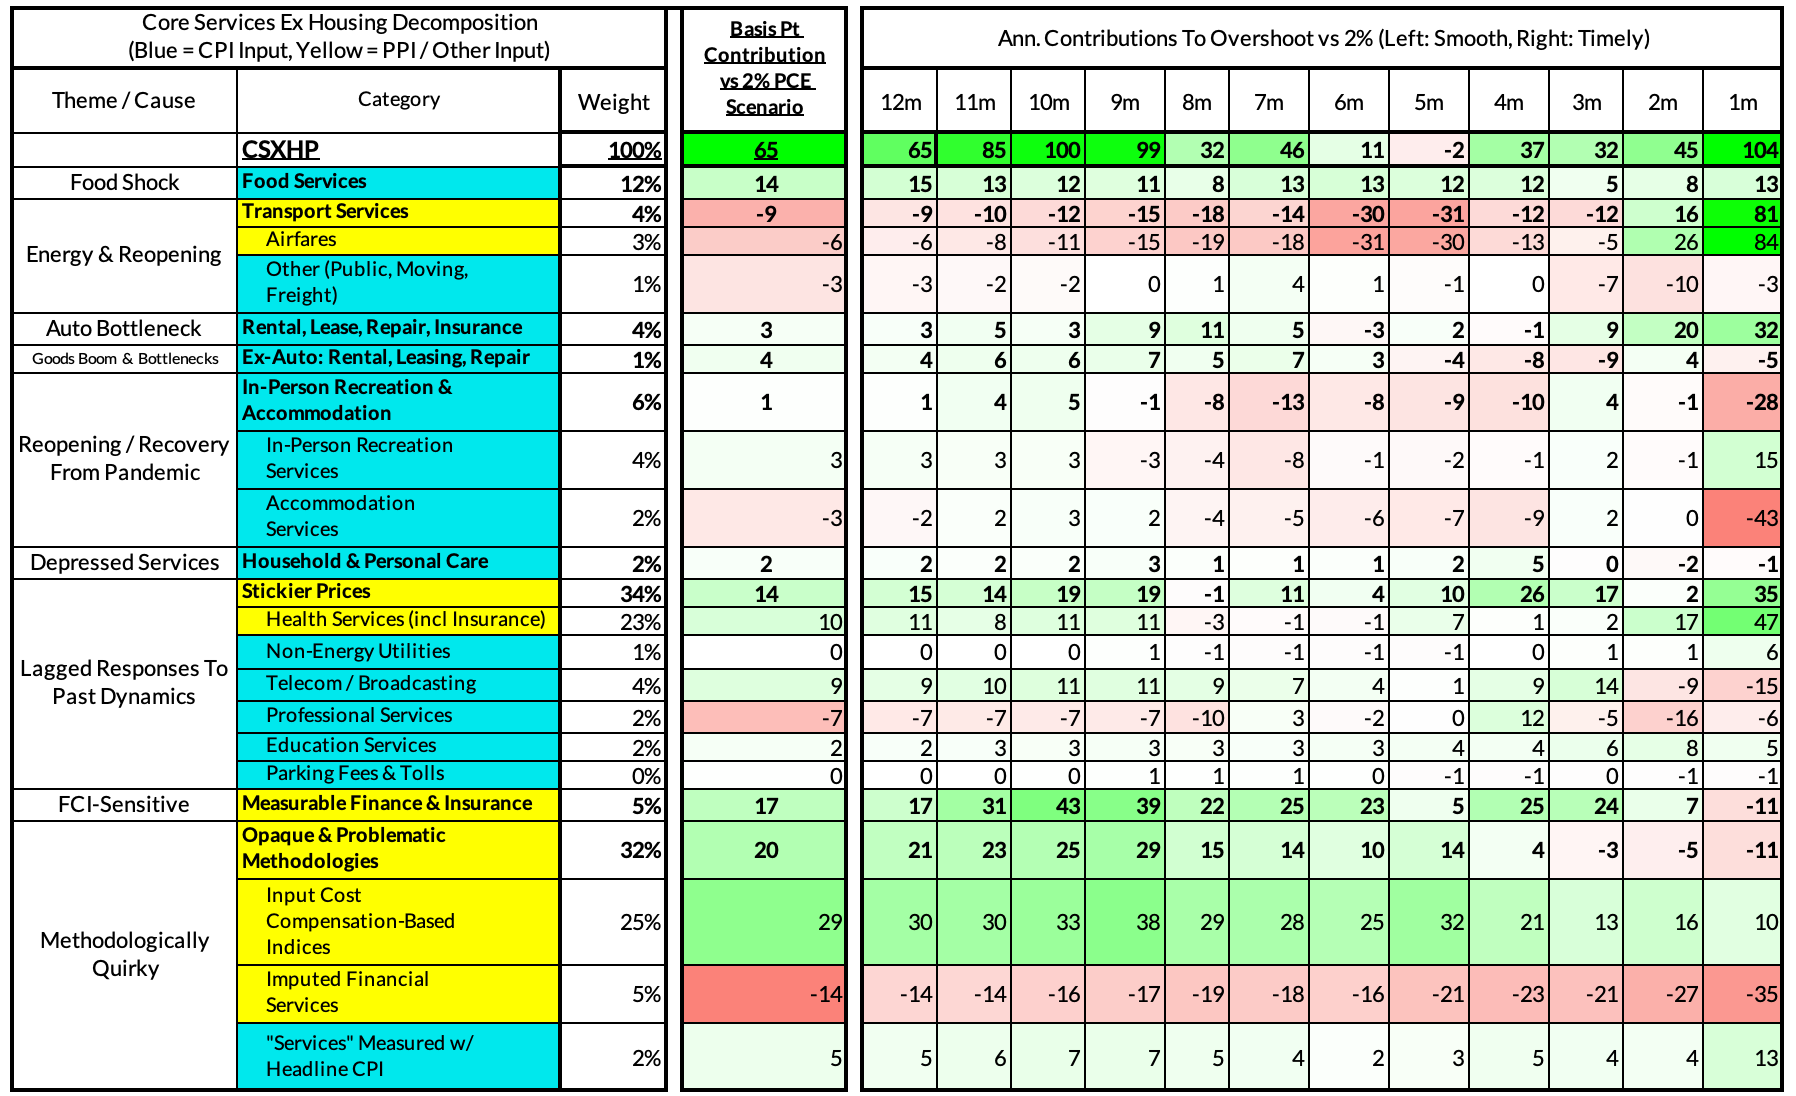
The September growth rate in "Core Services Ex Housing" ('Supercore') PCE is running at a 3.24% year-over-year pace, an 65 basis point overshoot versus the ~2.59% run rate that coincided with ~2% headline and Core PCE.
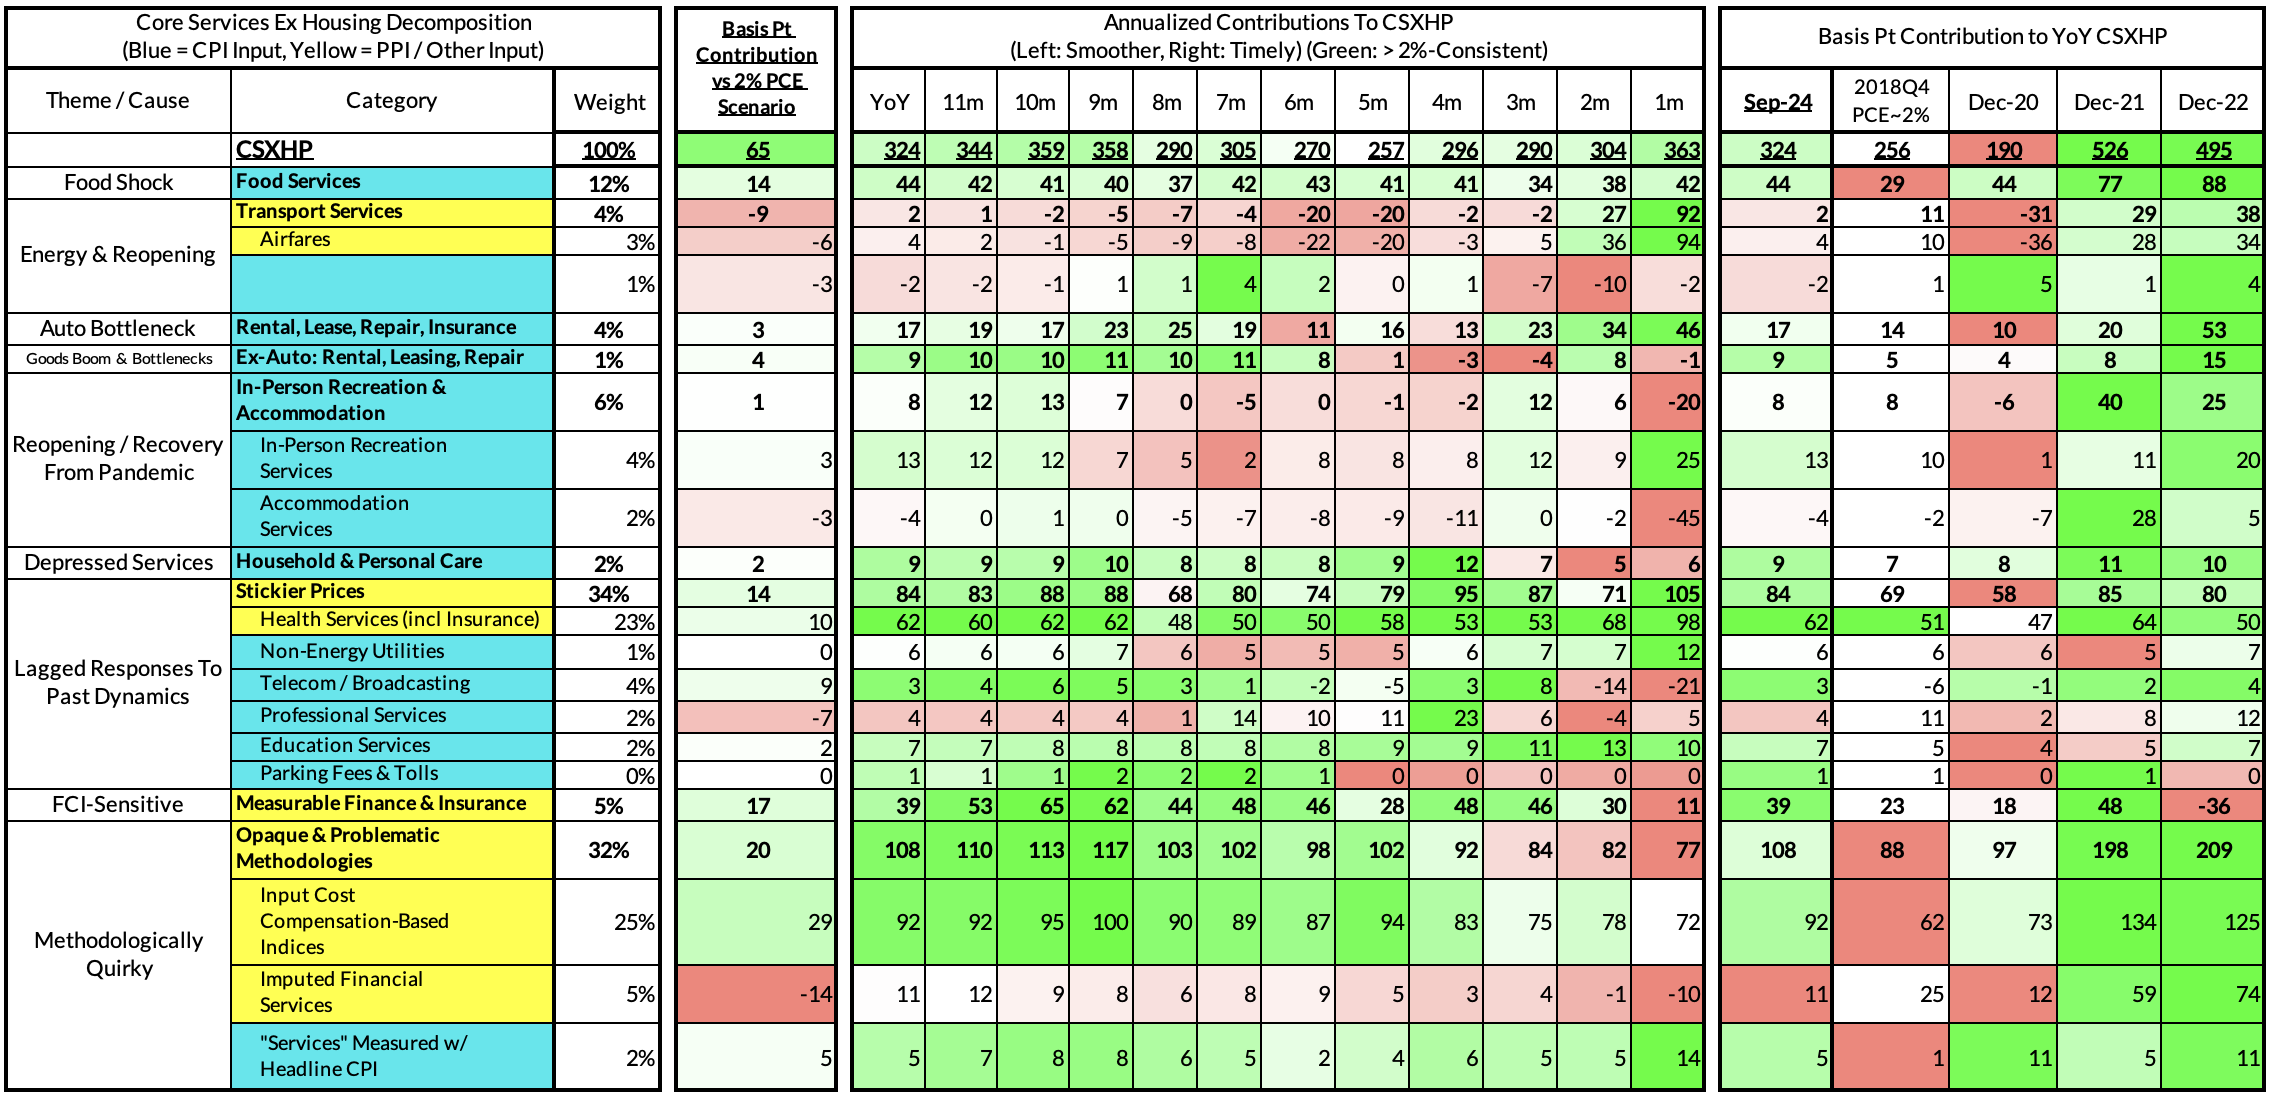
September monthly supercore ran at a 3.63% annualized rate, a 104 basis point annualized overshoot of what would be consistent with 2% Headline and Core PCE.
