This is a truncated version of the preview initially made available to our exclusive distribution this past Monday. Core-Cast is our nowcasting model to track the Fed's preferred inflation gauges before and through their release date. The heatmaps below give a comprehensive view of how inflation components and themes are performing relative to what transpires when inflation is running at 2%.
Most of the Personal Consumption Expenditures (PCE) inflation gauges are sourced from Consumer Price Index (CPI) data, but Producer Price Index (PPI) input data is of increasing relevance, import price index (IPI) data can prove occasionally relevant. There are also some high-leverage components that only come out on the day of the PCE release.
If you'd like to start a 90-day free trial of our exclusive content, you can do so using this link. If you have any questions or would like to see samples of our past content, feel free to get in touch with us.
Summary
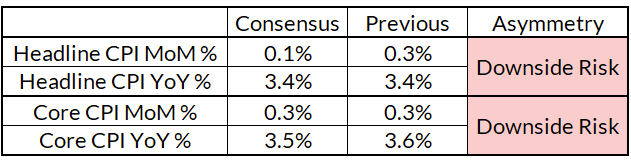
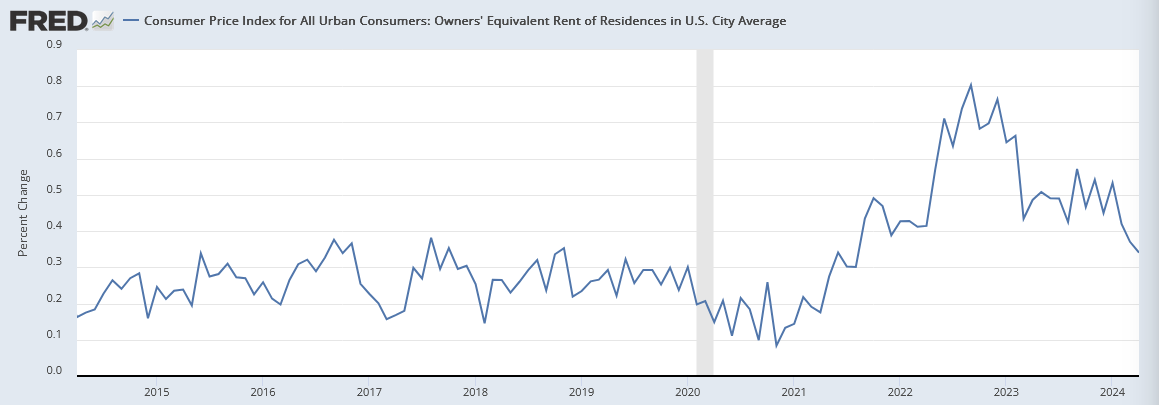
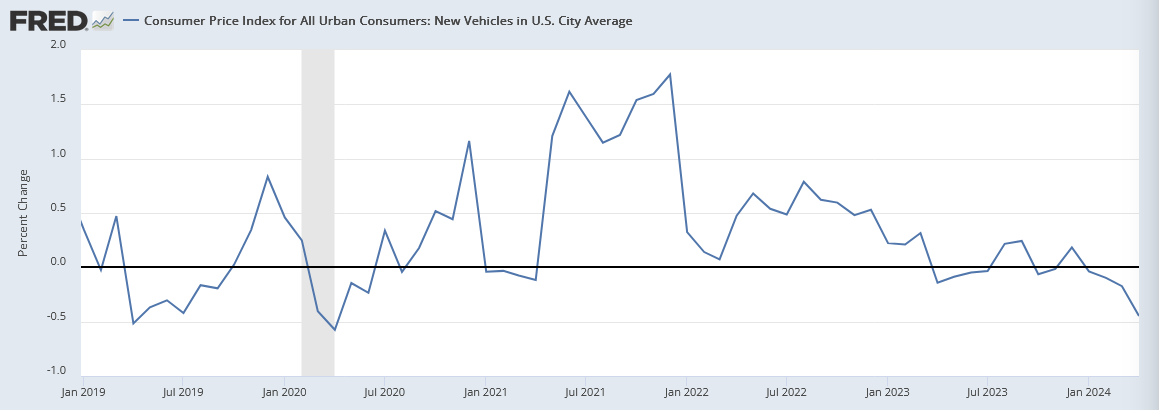
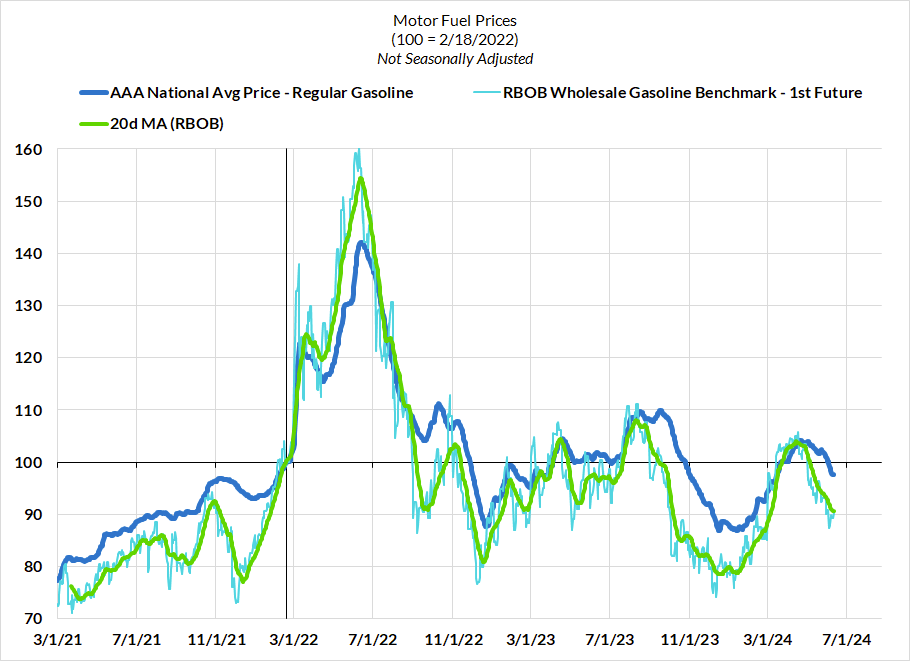
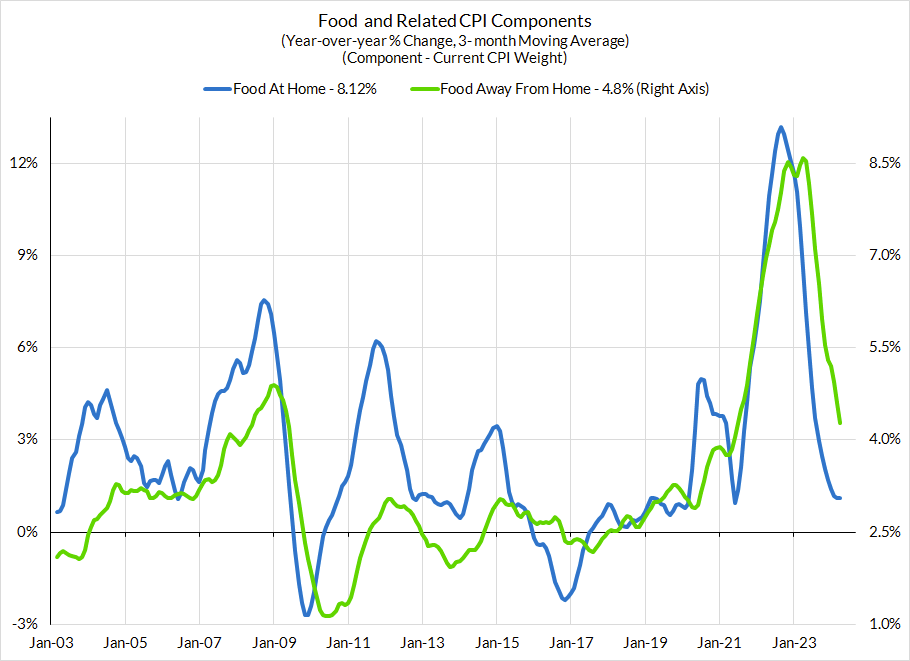
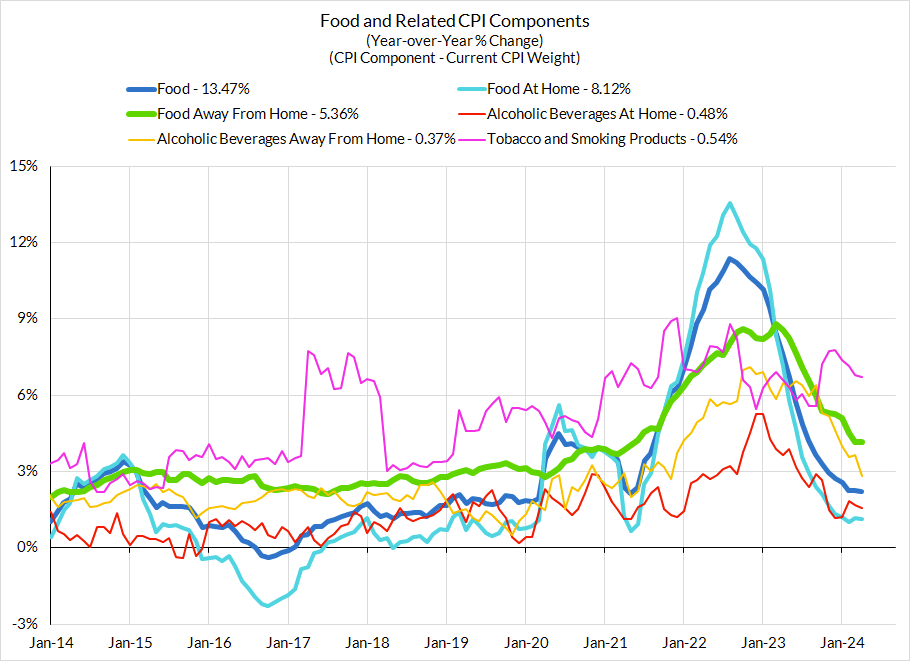
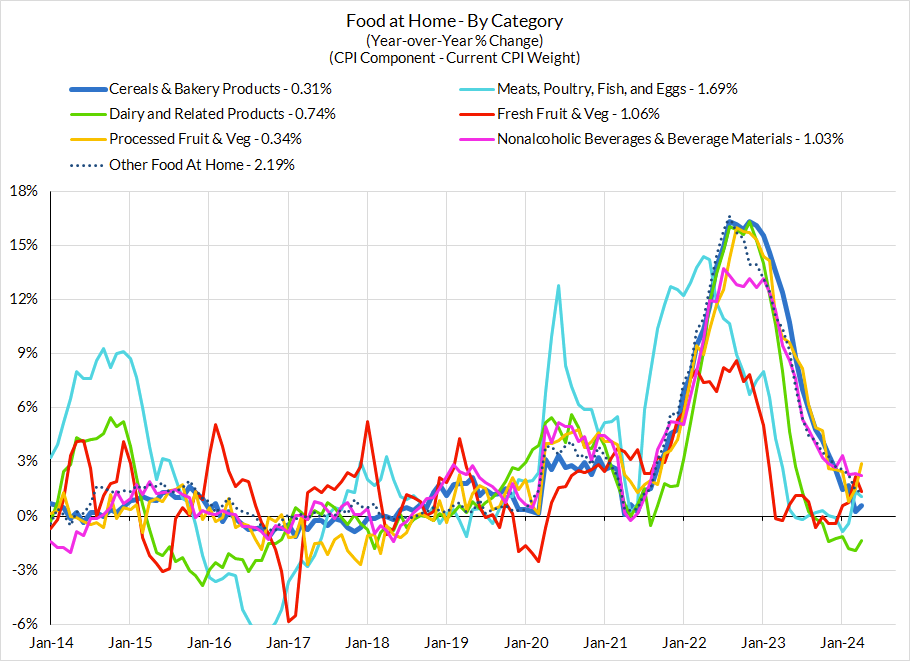
We see more downside risk vs consensus on both headline and core inflation: At the thrust of our inflation views is a more visible deceleration in rent (and owners' equivalent rent), new vehicles, and apparel inflation. These three have run stronger for different reasons but the combination of fundamental deceleration and favorable seasonals suggests at least less heat, if not meaningful cooling in outright terms. Energy prices are also poised to show more relief as gasoline prices begin falling through May and the first half of June, atypical for summertime. Falling grocery prices and decelerating food services prices should also aid "non-core" inflation.
- We see headline CPI growing at 0.05% month-over-month, on a knife's edge between 0.0% and the consensus forecast for 0.1%.
- We see core CPI growing at 0.24% month-over-month, just shy of the consensus forecast for a 0.3% gain.
Forecast Details
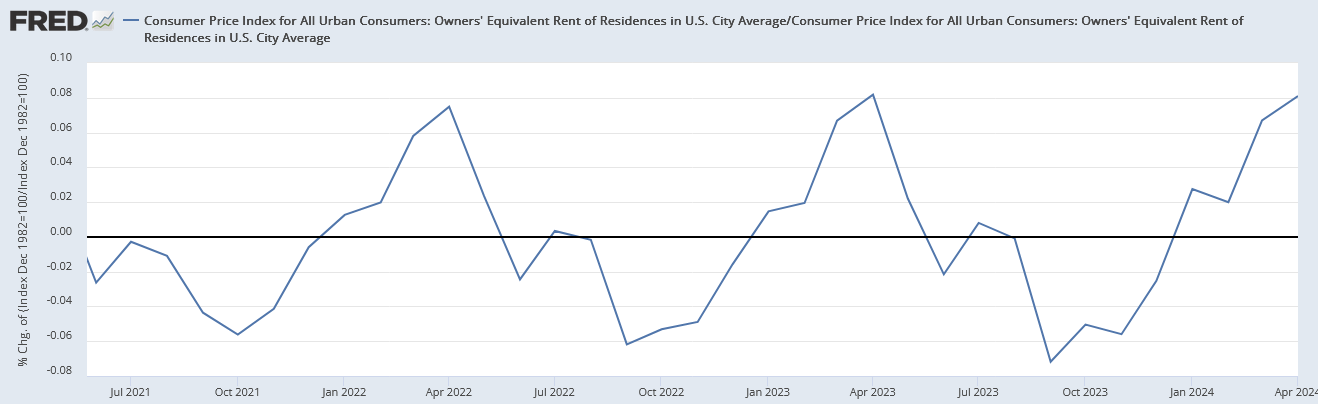
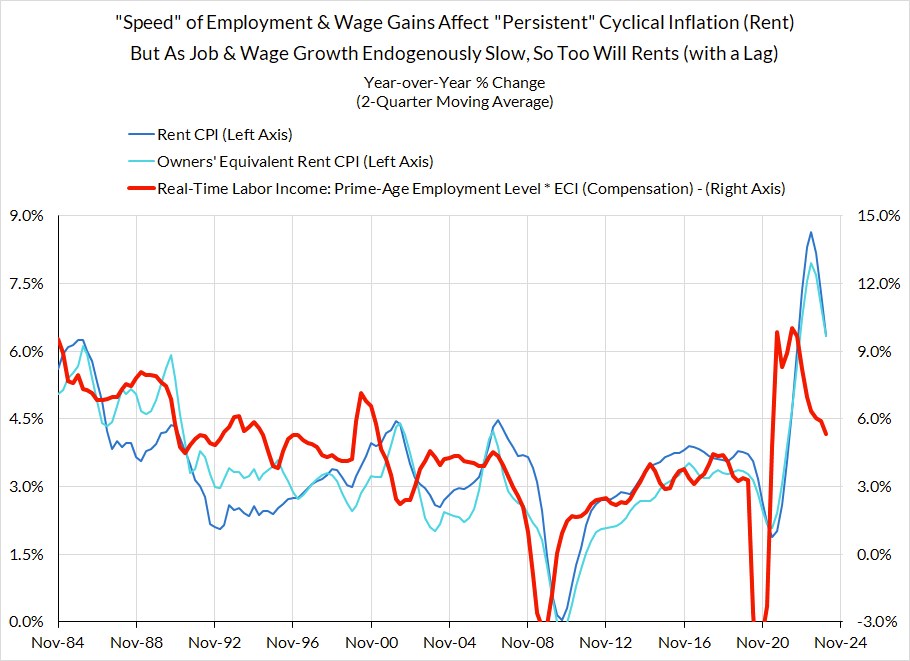
(1) Rent and OER are primed to show more visible seasonally adjusted deceleration: Rent and OER are showing more visible deceleration in the not-seasonally-adjusted (NSA) series than the seasonally adjusted series. While there is some seasonality in these time series, the latest revisions of the seasonal factors exaggerate how much of the deceleration in the first few months of the year is attributable to seasonality. Seasonal factors are currently adding 8 basis points to the NSA m/m OER CPI reading as of April. That support shifts to a 7 basis point drag by September, a net 15 basis point swing. This is technically of low relevance to aggregate core and headline CPI, but will be of relevance to Fed assessments and to how PCE inflation gauges get aggregated.
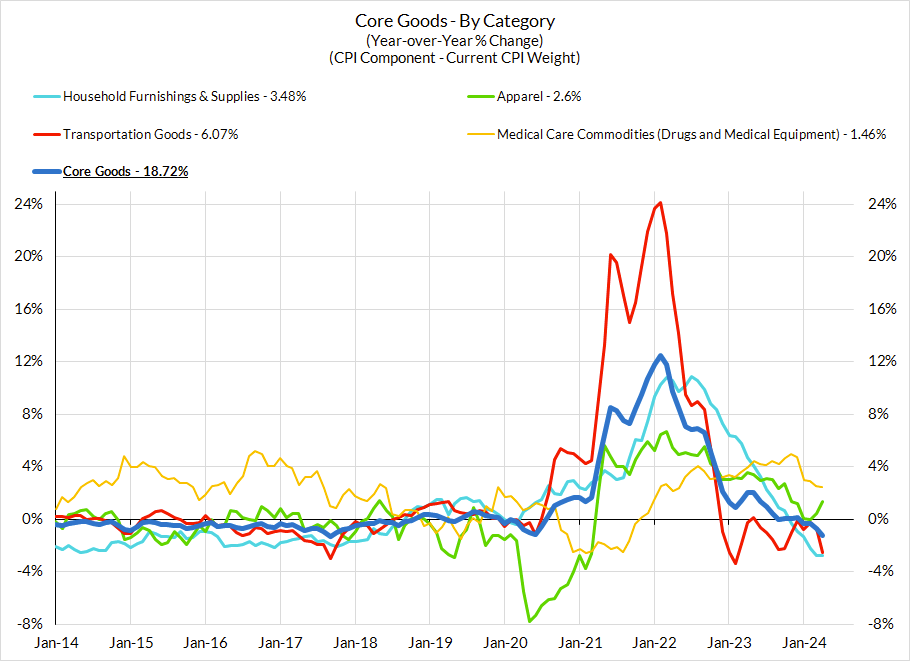
(2) New vehicle price deflation is finally poised to show up more meaningfully in the coming months. In April we saw what should be the first of multiple and sizable declines in New Vehicles CPI. Private sector data on new vehicle prices have long been signaling sizable price declines and CPI methodology choices suggest good reason for latency. That latency should ultimately give way to realized price declines through much of 2024.
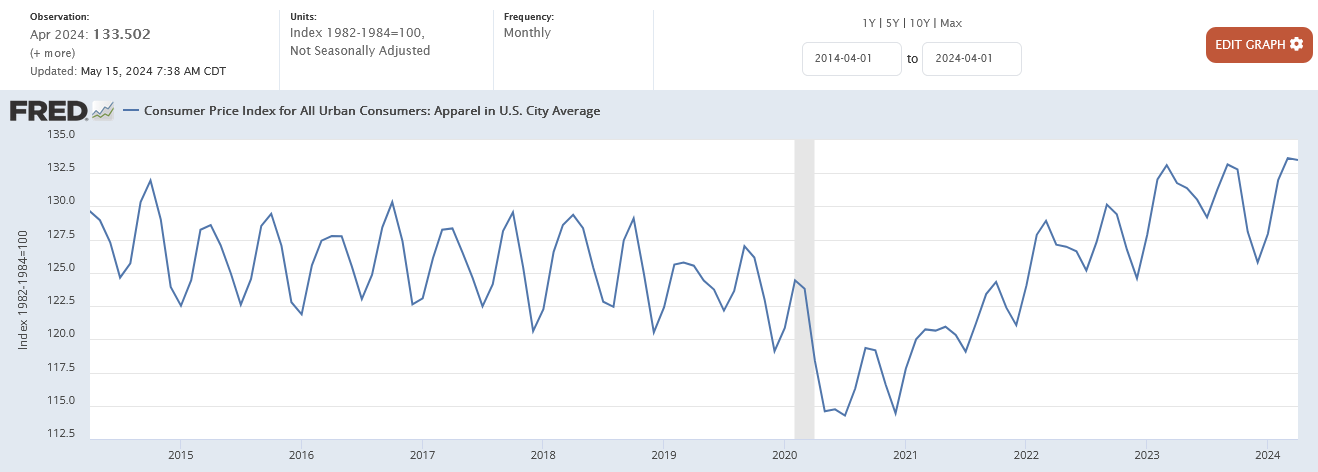
(3) Is there really genuine apparel inflation afoot? Judging from just the first four months of the year and the seasonally adjusted series of Apparel CPI, the answer would be most obviously yes.
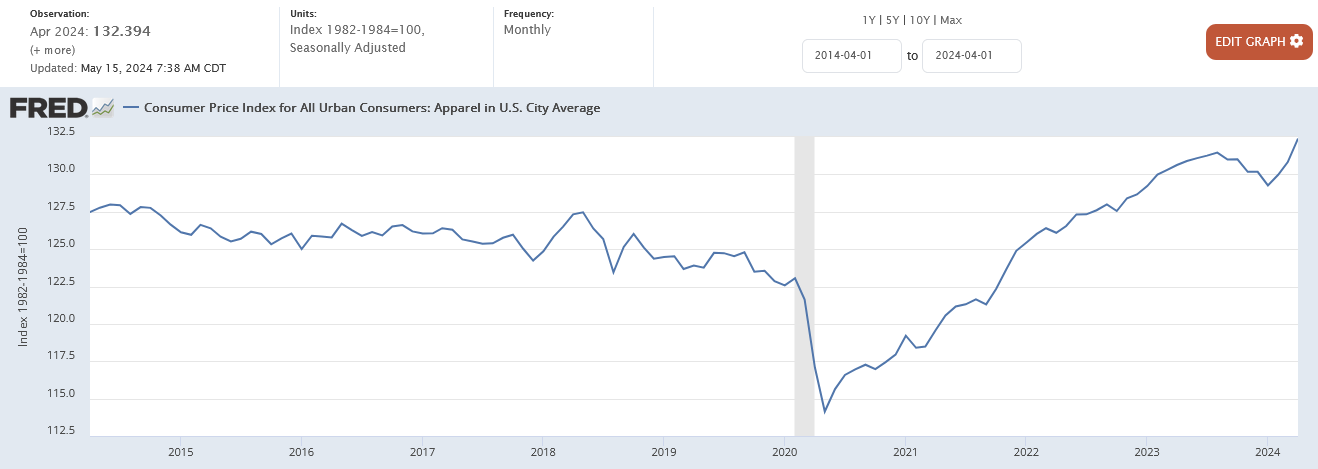
But unlike OER, where seasonality is likely overestimated, Apparel seasonal dynamics are likely being underestimated (residual seasonality). It's possible much of the H2 deflation reflected this as well, but we are skeptical that the the last 4 months deserves extrapolation. Nominal spending and real consumption of apparel have been tepid to outright weak in recent months and quarters.
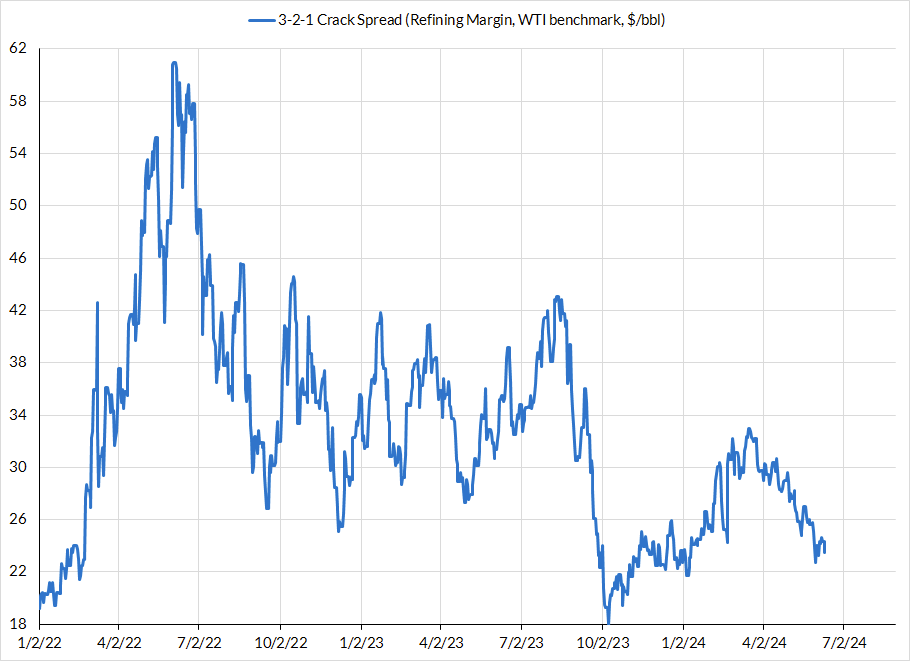
(4) Commodity price deflation and stabilization aids the Core Services PCE outlook. Falling energy prices do not just matter for headline measures of inflation. Two critical linkages flow to major segments of Core Services PCE: airfares & food services. Jet fuel prices staying stable with a bias to falling (as a result of falling refining margins) bodes well for airfares to remain in a stable price and inflation range. Diesel prices also showing more deflation has tangible benefits to food distribution costs, which enables grocery and restaurant prices to remain stable. While restaurant pricing is not a part of Core CPI, it is a major part of both Core and "Supercore" PCE aggregates. We expect to see more food services deceleration in the months ahead
CPI Charts
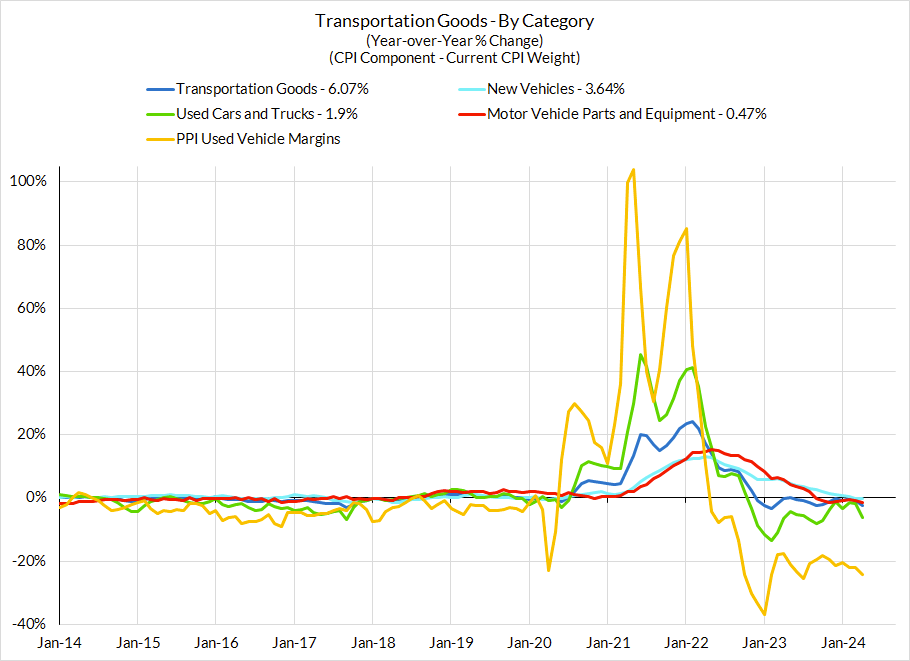
Non-Core CPI Components
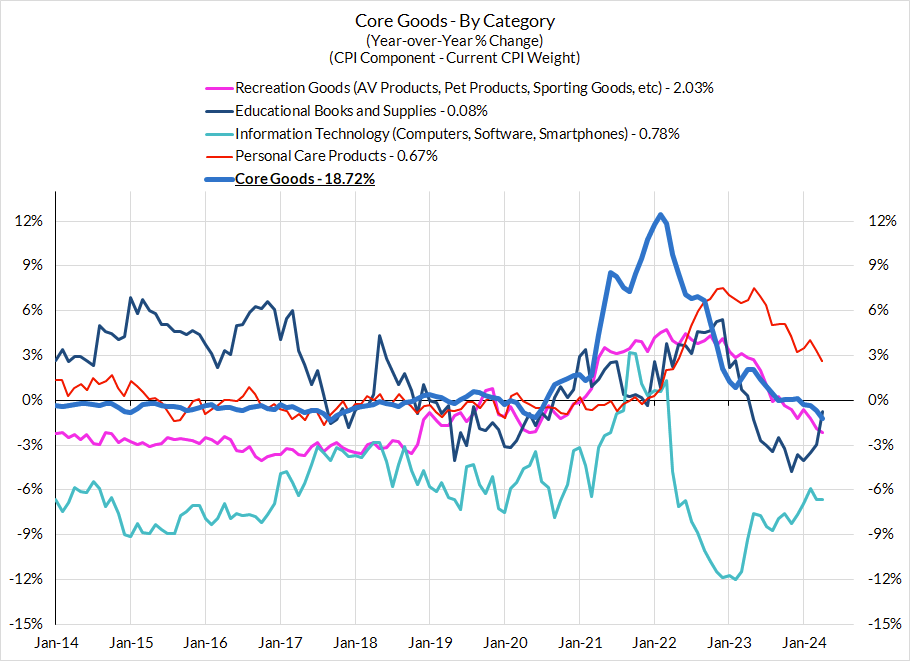
Core Goods CPI Components
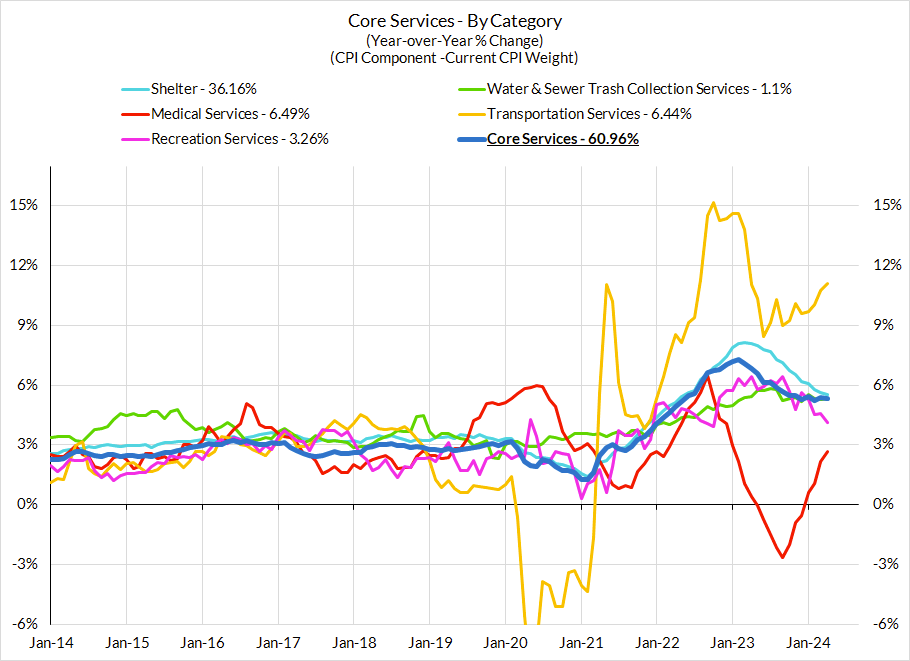
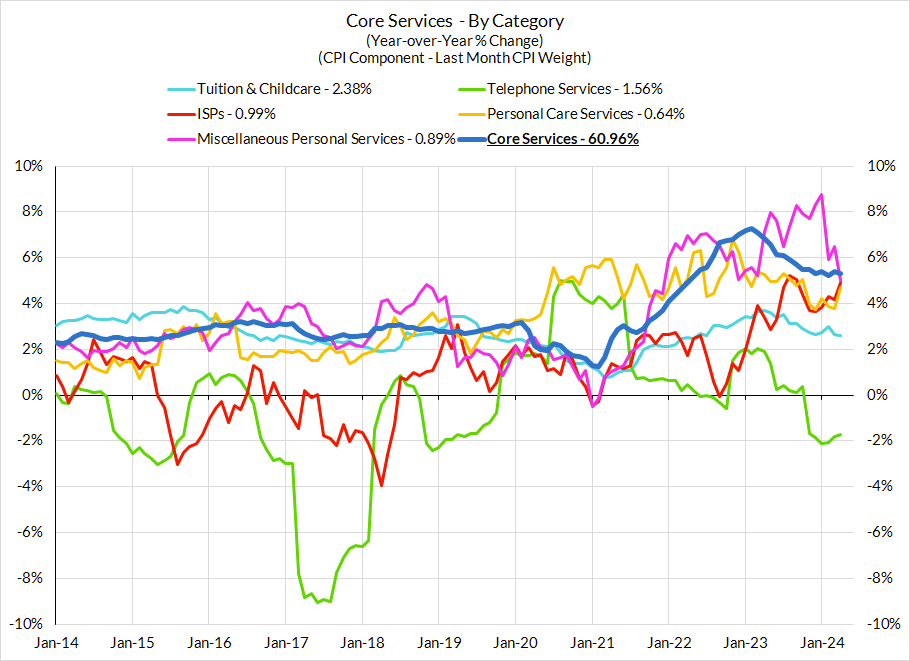
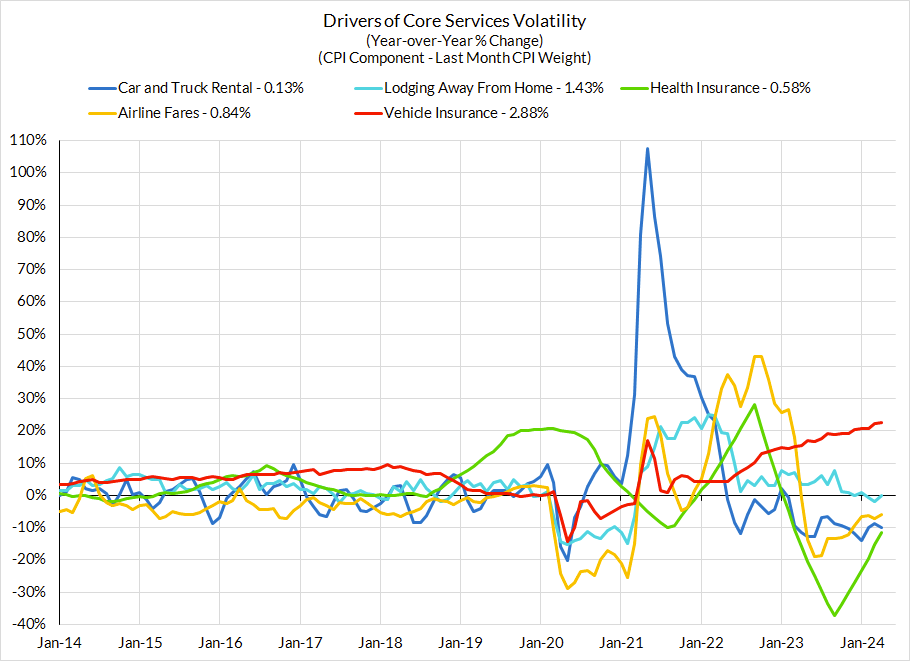
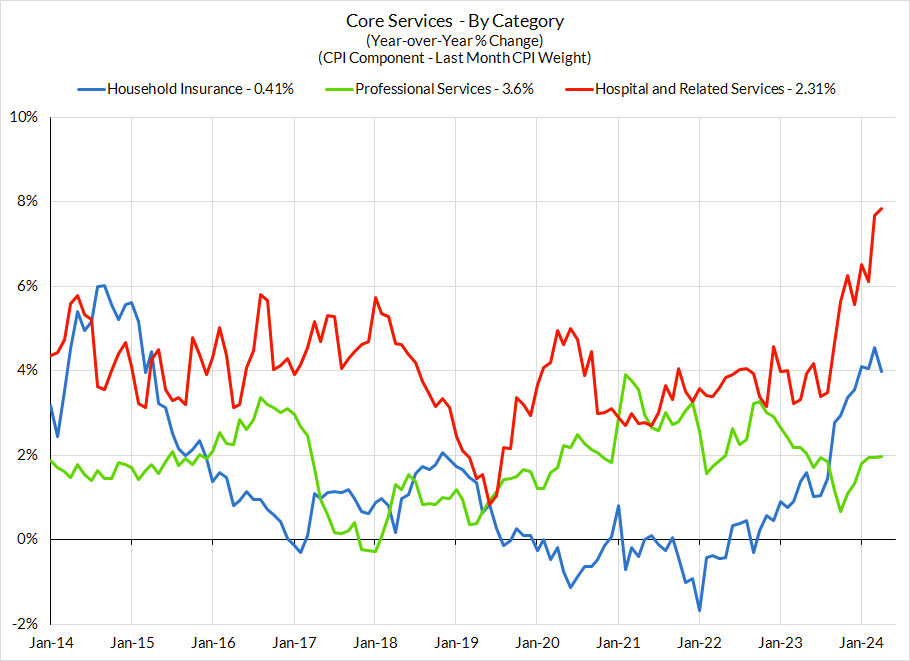
Core Services CPI Components (Not All Feed Into Core PCE)
From Last PCE Recap
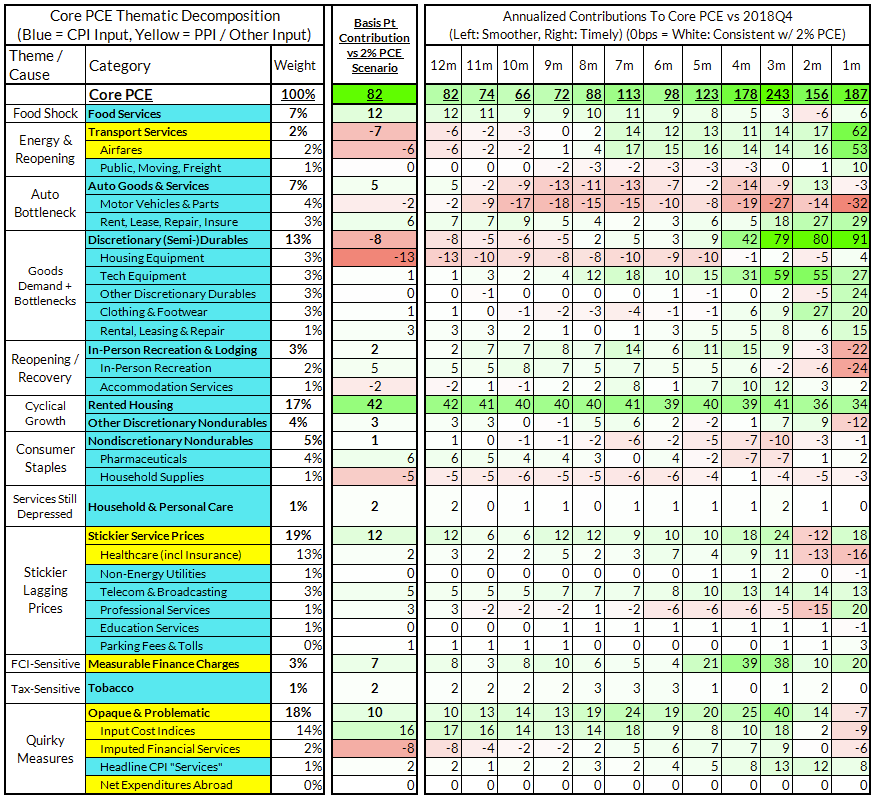
For the Detail-Oriented: Core PCE Heatmaps
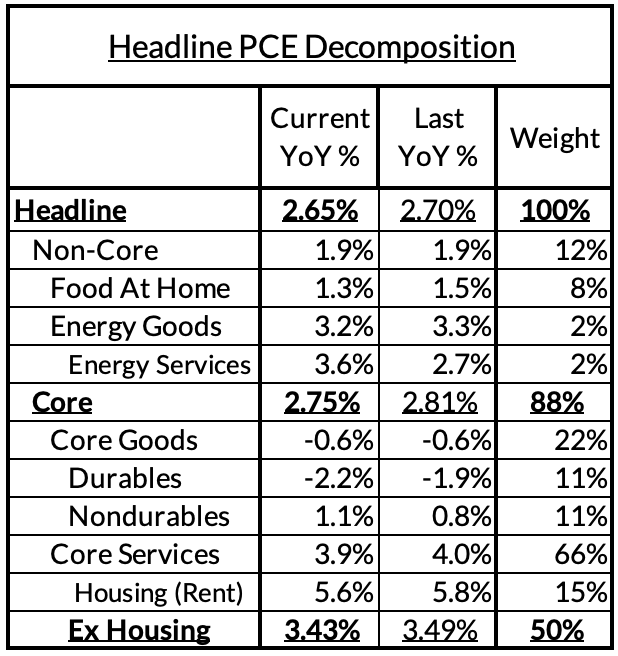
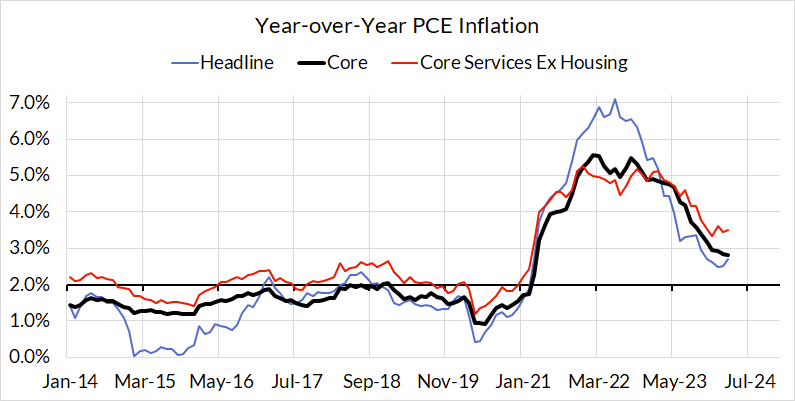
Core PCE (PCE less food products and energy) ran at a 2.82% year-over-year pace as of March, 82 basis points above the Fed's 2% inflation target for PCE. That overshoot is disproportionately driven by catch-up rent CPI inflation in response to the surge in household formation (a byproduct of rapidly recovering job growth) and market rents in 2021-22. Rent is contributing 42 basis points to the 86 basis point core PCE overshoot.
There are other contributors to the overshoot:
- Some more supply-driven (food inputs likely added 12 basis points to the overshoot, motor vehicle bottlenecks adding 5 basis points)
- Some more demand-driven (in-person recreation and travel services likely added 2 basis points to the overshoot)
- Some oddball segments have aggravating effects (measured financial service charges now likely adding 7 basis points, while contributions from input cost indices and imputed financial services likely adding 8 basis points to Core PCE vs 2%-consistent outcomes).
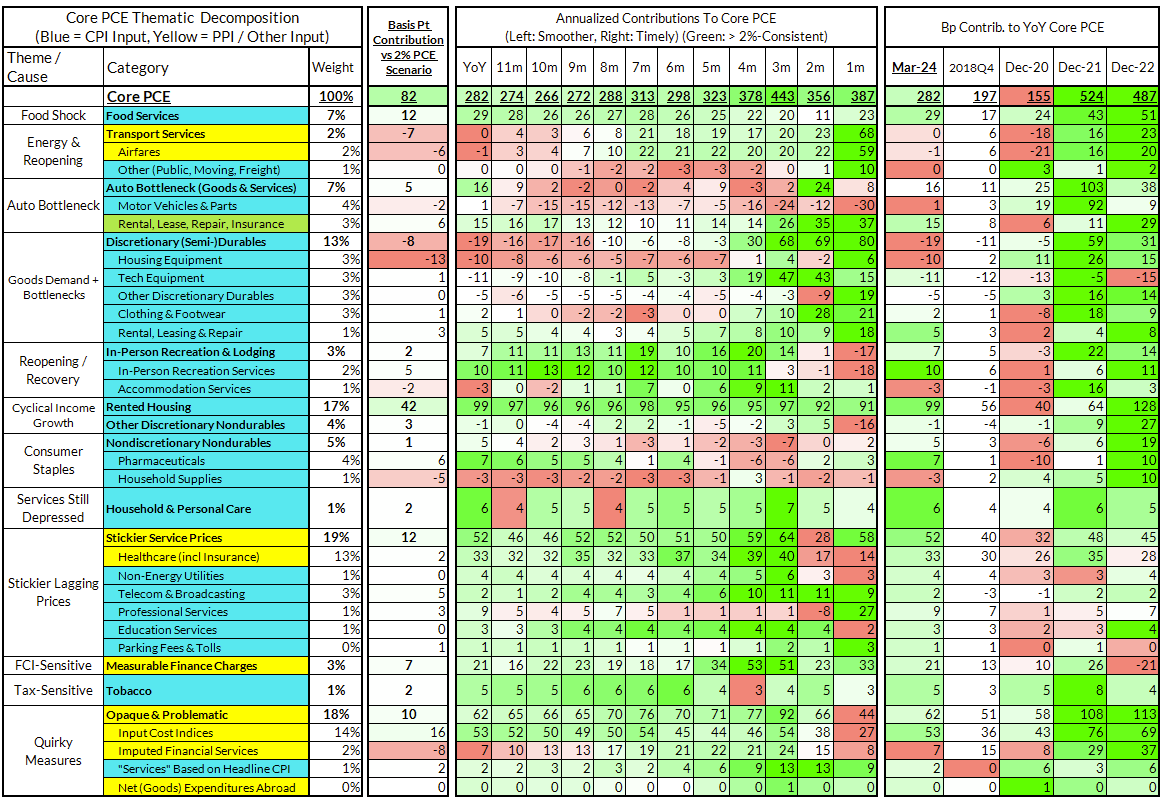
The final heatmap below gives you a sense of the overshoot on shorter annualized run-rates. March monthly annualized core PCE yielded a 187 basis point overshoot vs 2% target inflation (3.87% annualized).
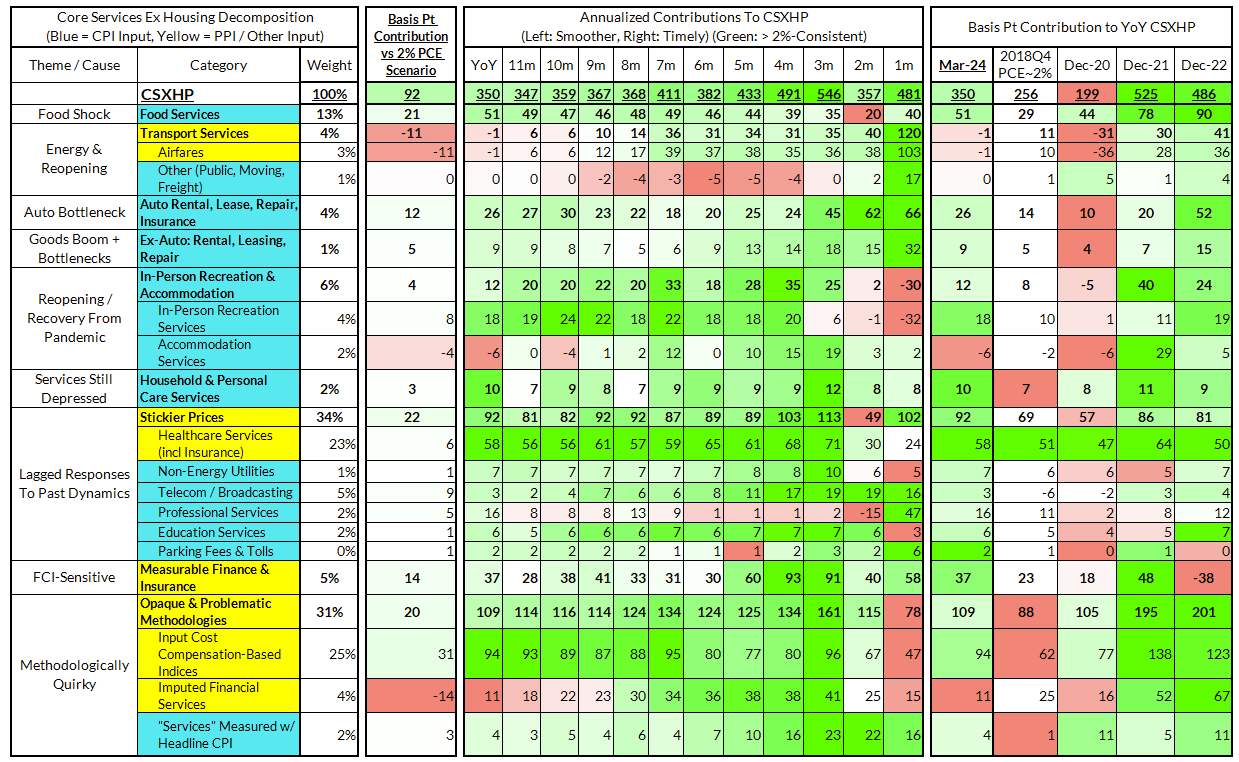
For the Detail-Oriented: Core Services Ex Housing PCE Heatmaps
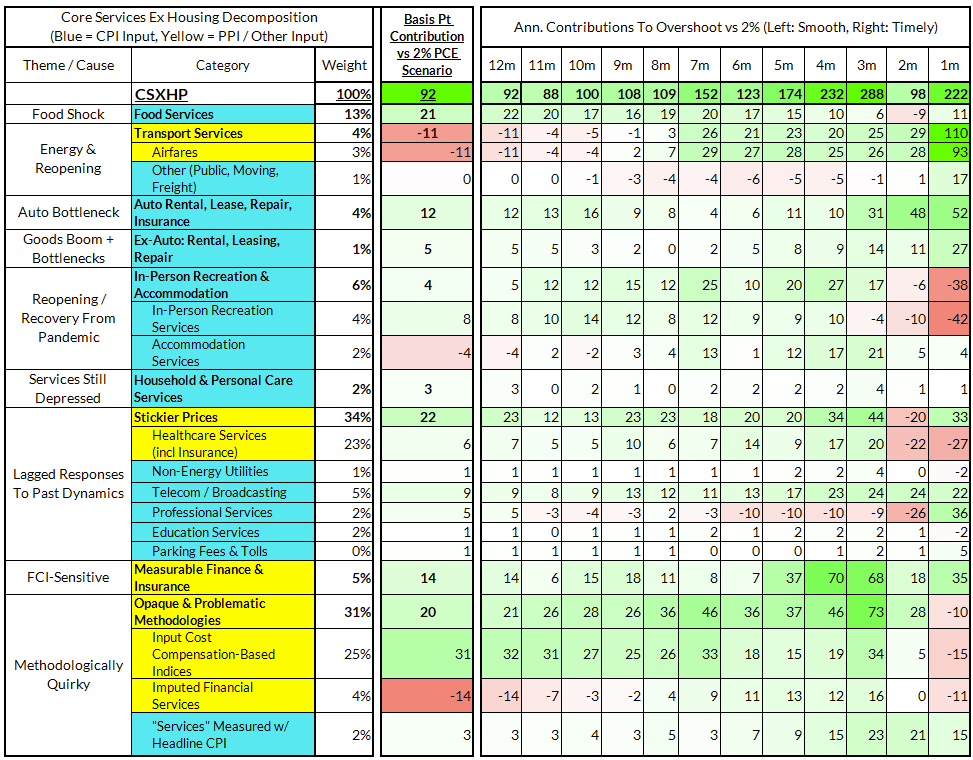
The March growth rate in "Core Services Ex Housing" ('supercore') PCE ran at 3.50% year-over-year, a 92 basis point overshoot versus the ~2.59% run rate that coincided with ~2% headline and Core PCE.
March monthly supercore ran ata 4.81% annualized rate, a 222 basis point annualized overshoot of what would be consistent with 2% headline and core PCE.
Past Inflation Previews & Commentary
- 2/12/21: The Good, The Bad, and The Transitory
- 10/27/21: Offsetting Persistent Inflationary Pressures With Disinflationary Healthcare Policy
- 11/8/21: Q4 CPI Preview: What Will Hot Q4 Inflation Tell Us About 2022 Dynamics?
- 12/9/21: November CPI Preview: Planes, Constraints, and Automobiles: What to Look For in a Hot November CPI Print
- 2/9/22: January CPI Preview: Calendar Year Price Revisions Skew Risks To The Upside in January, But The Balance of Risks May Shift Soon After
- 3/9/22: Feb CPI - Short Preview: Inflection Points - Headline Upside (Putin), Core Downside (Used Cars)
- 4/11/22: March CPI Preview: Managing The Endogenous Slowdown: Transitioning From A Rapid Recovery To Non-Inflationary Growth
- 5/10/22: April CPI Preview: Subtle Headline CPI Upside, But Core PCE Should Reveal More Disinflation
- 6/9/22: May Inflation Preview: Peak Inflation? Not So Fast, My Friend. Upside Surprises Loom Large
- 7/12/22: June Inflation Preview: Lagging Consensus Catches Up To Hot Headline, But Relief Nearing…
- 8/8/22: July Inflation Preview: Finally, Fewer Fireworks
- 9/9/22: August Inflation Preview: Can Used Cars & Gasoline Overcome The Rest of The Russia Shock?
- 10/12/22: September Inflation Preview: Timing The Goods Deflation Lag Amidst Hot Inflation Prints
- 11/12/22: October Inflation Preview: When Will We See The 'Real' Goods Deflation Materialize? Until Then, Rent Rules Everything Around Me
- 12/12/22: November Inflation Preview: The Goods Deflation Cavalry Is Coming, But OER Can Upset An Optimistic Consensus Tomorrow
- 1/11/23: December Inflation Preview: Risks Skew To The Downside, But Upside Scenarios Remain Plausible
- 2/12/23: January Inflation Preview: Residual Seasonality & Stickier Services Pose Upside Risks
- 3/9/23: February Inflation Preview: Q1 Upside Risks Remain. Goods and Reopening-Sensitive Sectors Matter More Than Wages
- 4/8/23: March Inflation Preview: The Fed Seems Unaware We're Entering Another Automobile Inflation Storm
- 5/7/23: April Inflation Preview: Can PCE Silver Linings Overcome CPI Bite from the Used Cars Wolf and a "Slow Slowdown" in Rent CPI?
- 6/9/23: May Inflation Preview: Last Month of Used Cars Driving Upside Risk?
- 7/9/23: June Inflation Preview: The Path To The Fed's 2% PCE Goals Is Getting Clearer But Not Soon Enough To Forestall a July Hike
- 8/8/23: July Inflation Preview: Used Car Downside Can Hasten Path To 2% Core PCE Outcomes
- 9/12/23: August Inflation Preview: CPI Risks Growing More Balanced Even As PCE Risks Tilt More To The Downside
- 10/10/23: September (Pre-PPI) Inflation Preview: The Wedge Will Matter Again...Pulling Up CPI and Pushing Down PCE
- 11/13/23: October Inflation Preview: A Data Release That Can Dictate The Future of The Hiking (& Easing?) Cycles
- 12/11/23: November Inflation Preview: Headline Downside But Can Core PCE Keep A March "Normalization Cut" In Play?
- 1/10/24: December Inflation Preview: How Much More Disinflation Can Be "Banked" Before Q1 Begins?
- 2/9/24: January Inflation Preview: High Stakes Data Releases With Fat Tails On Both Sides
- 3/9/24: February Inflation Preview: Jan-Feb Residual Seasonality Poised To Stoke Upside & Headfake The Fed
- 4/9/24: March Inflation Preview: Relief Growing More Likely Over The Residual Seasonality Hump
- 5/10/24: April Inflation Preview: Tech, Stocks & Seasonals: What Went So Wrong (& Right) In Q1? What Does It Tell Us About Q2?