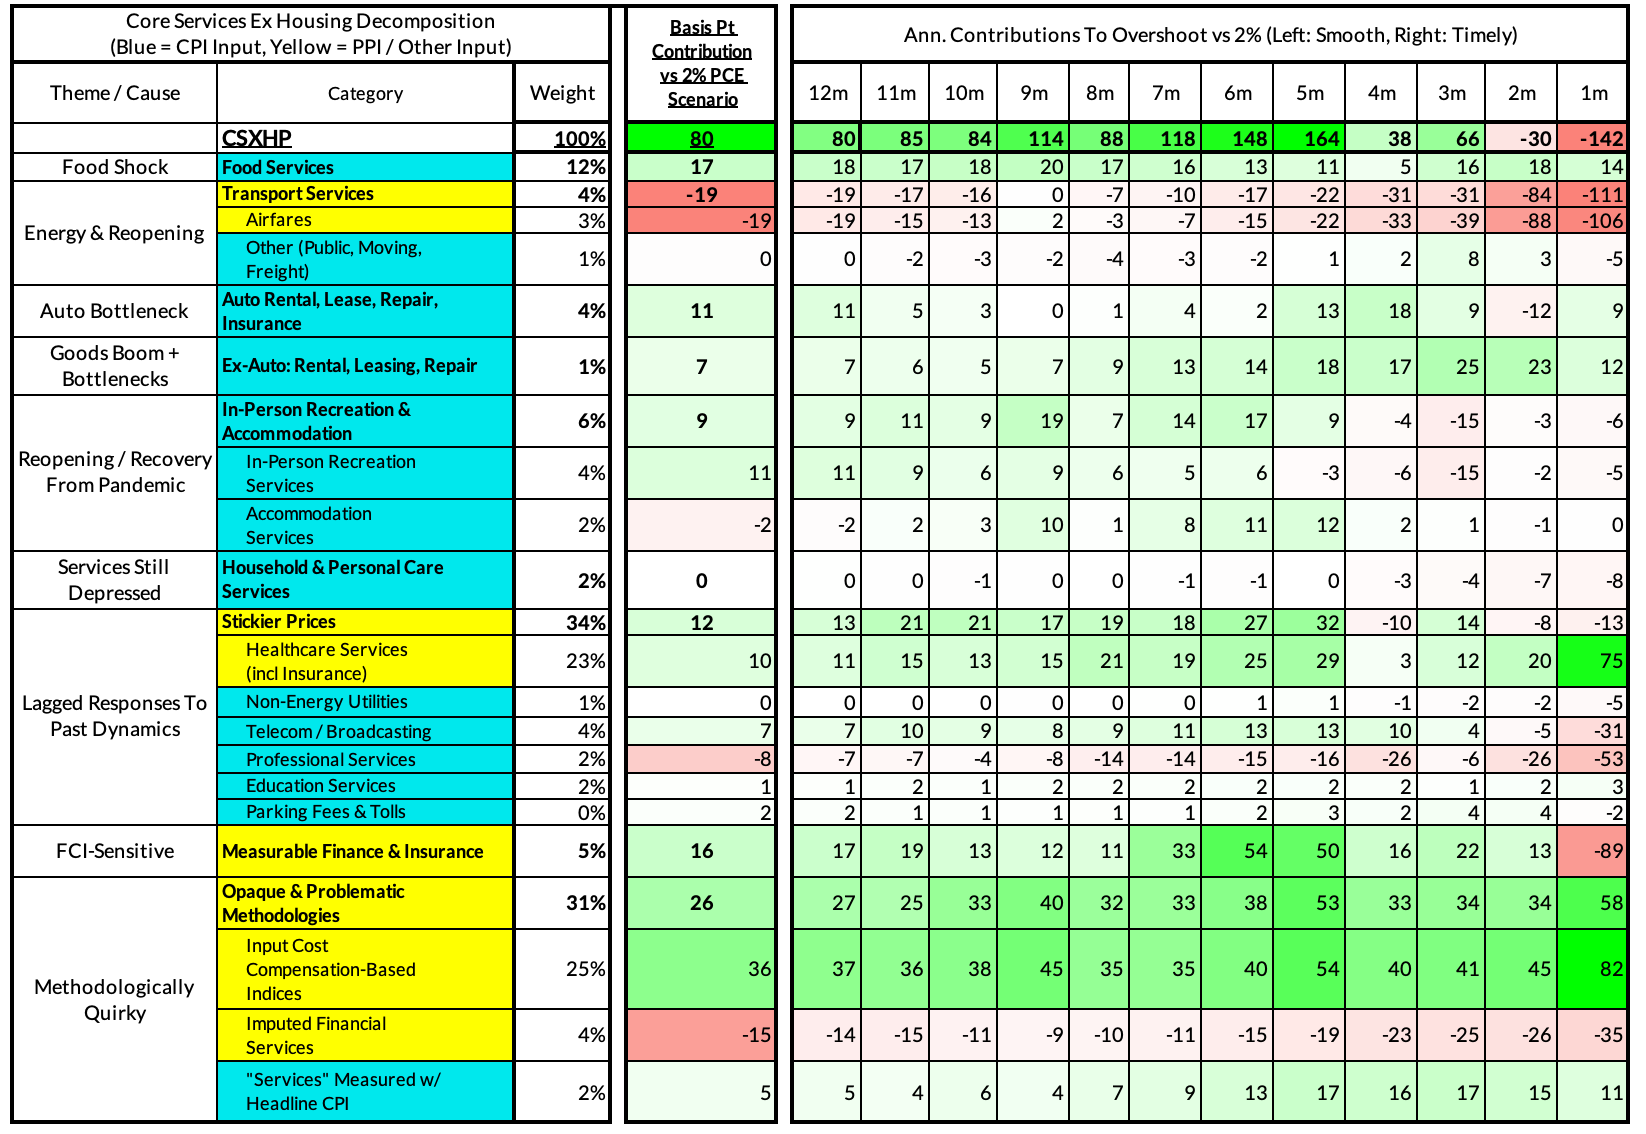
Core-Cast is our nowcasting model to track the Fed's preferred inflation gauges before and through their release date. The heatmaps below give a comprehensive view of how inflation components and themes are performing relative to what transpires when inflation is running at 2%.
Most of the Personal Consumption Expenditures (PCE) inflation gauges are sourced from Consumer Price Index (CPI) data, but Producer Price Index (PPI) input data is of increasing relevance, import price index (IPI) data can prove occasionally relevant. There are also some high-leverage components that only come out on the day of the PCE release.
If you'd like to start a 90-day free trial of our exclusive content, you can do so using this link. If you have any questions or would like to see samples of our past content, feel free to get in touch with us.
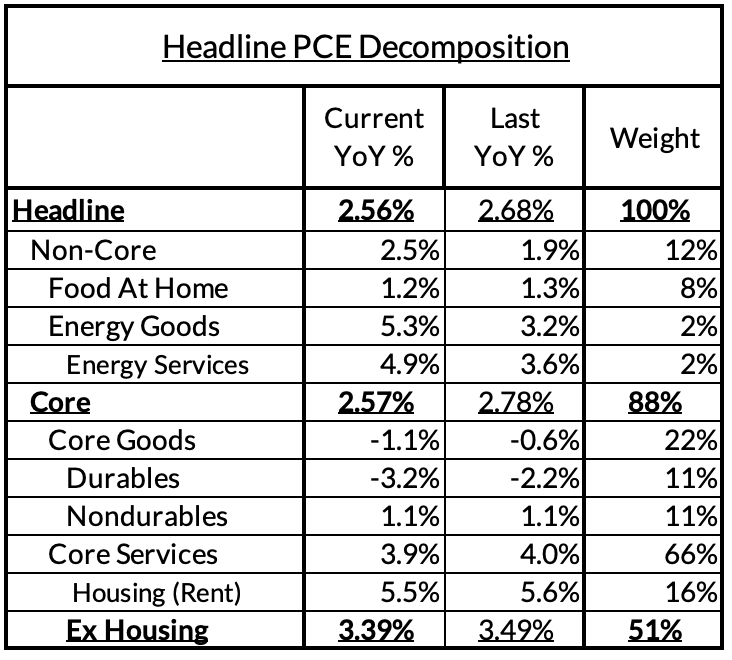

Summary: Final Readings For PCE
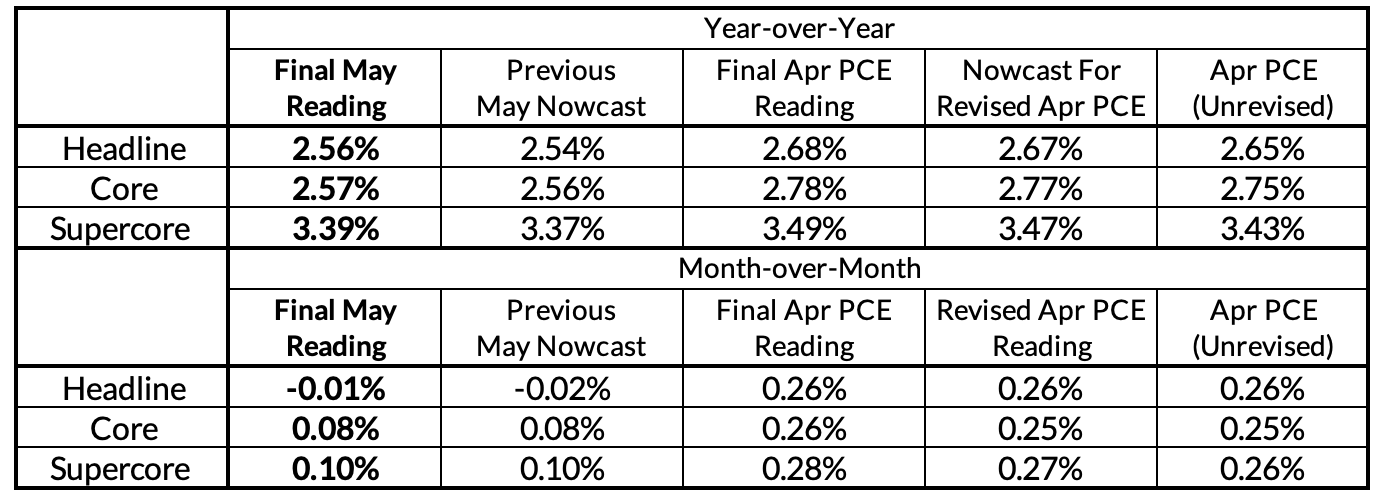
Sometimes our nowcasts are marginally off relative to what we finally learn on the day of the PCE release, but for the month of May at least, our post-PPI nowcasts were all highly aligned with what ultimately materialized. Core PCE came in right in line with our nowcast on a month-over-month basis and only 1 basis point off on a year-over-year basis. Across all of the relevant figures we nowcast, errors were no greater than 2 basis points.
We did not learn anything groundbreakingly new today as a result, but for the majority of nowcasters who were penciling in a higher month-over-month nowcast, today's data provides clarity about how disinflationary PCE outcomes have actually been. We see today's data as confirmation that September is the right baseline view for the first interest rate cut. Should we get more information consistent with—and potentially softer than—the May inflation data in the coming months, the case for the Fed cutting as many as three times this year will start to look more feasible to more Fed-watchers and market participants.
It is true that while year-over-year readings for Core PCE have consistently fallen with each passing month, the comparisons in the back half of the year will get more difficult (given the relative softness of 2023H2 readings relative to 2023H1). Nevertheless, we expect to see continued softness in H2 as we see more visible deceleration in rent and OER readings alongside weaker vehicles inflation (new and used) and reversing residual seasonality in other goods prices (apparel, IT commodities, household furnishings). In that backdrop, and with still-slowing goods-adjacent services inflation (e.g. food services, motor vehicle services), we should be on track for further progress on Core PCE over the next 12-18 months.
In the process of overreacting to short-term inflation data, the Fed has now systematically under-reacted to the consistent progress in year-over-year inflation readings, which now reside at 2.57%. Even with a conservative accounting of methodology-driven lags to rent and owners' equivalent rent housing PCE components, Core PCE would be 2.19% on a year-over-year basis. That's a mile away from where their PCE inflation gauges were when they raised rates above 5% in May 2023: Core PCE was 4.78% y/y, and even if adjusted for housing, it would have still been 3.98% y/y. That's 221 basis points of progress on Core PCE year-over-year and 179 basis points of progress attributable to non-housing sources.
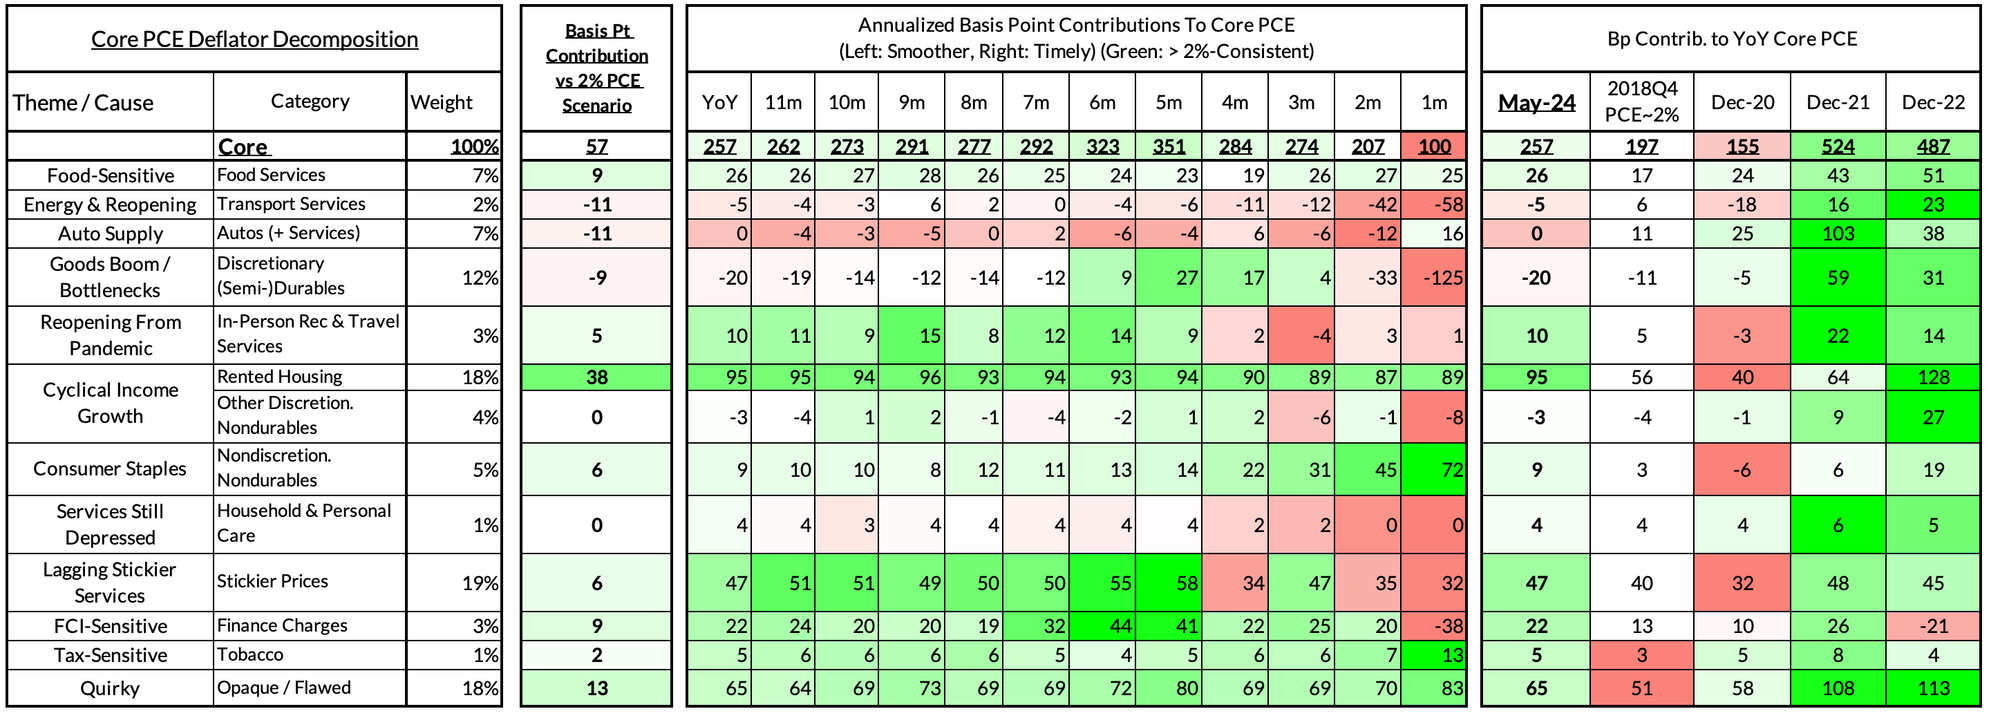
Despite what are apparently positive developments in returning to the inflation target, the Fed is highly unlikely to cut rates in July, barring a big deterioration in labor or financial markets. The only optimistic scenario in which the Fed is cutting as early as July involves large downside inflation surprises both for June and preceding months (via revisions).
Prescriptive Commentary
The Fed is signaling heavy reluctance to cut in July, but a more consistent approach to data-dependence justifies imminent and scalable adjustments to policy rates. What we think should happen often will not align with what we think will happen, and here is no exception. In our (prescriptive) view, if the inflation data cooperates for June, that should be enough for the Fed to consider a July interest rate cut, irrespective of whether the labor market shows further material slowing in June. FOMC members have been overly obsessed with the gyrations of month-over-month and quarter-over-quarter readings that are just too susceptible to volatility amidst shifting seasonal patterns.
A 5.33% Fed Funds Rate was far more defensible when there was a material risk that inflation would be stuck around 3.5% to 3.7%. It was clear from Fed communications during the hiking cycle that they were adopting a soft Taylor Rule logic to scale real interest rates accordingly, though with some understanding that at least some of the inflation they were seeing at the time would dissipate. While the Fed isn't tied to the mast of a Balanced Taylor Rule (nor should it), current inflation outcomes and the inflation outlook just look increasingly out of place with how policy was calibrated in 2023.
The Fed is arguably locking itself out of the option to recognize in July that inflation is simply in a very different place from what they anticipated a year ago. The Fed's June 2023 projections implied 3.3-3.6% y/y Core PCE on a one-year-forward basis. Those projections were paired with a ~4.83% policy rate. One year later, the actual inflation overshoot is roughly a third of what they anticipated despite housing inflation still disappointing due to methodology-driven lags. Meanwhile, the Fed Funds Rate is actually higher than what they projected a year ago, and the divergence is growing larger by the month.
The more that the Fed chooses to lag the improving inflation data, the stronger the case that the Fed should be engaged in faster interest rate adjustments when they do decide it's time to cut. If the Fed knew the realized outcomes at the time they were raising rates, their terminal interest rate would not have surpassed 5% in the first place (nor is it obvious the last few hikes moved inflation outcomes at the margin). That growing inconsistency favors starting interest rate cuts at a faster speed. It remains to be seen whether the Fed will be open to this logic, but we would hope that once rent and OER show a more visible and decisive slowing in the monthly data, the Fed would pivot to reflecting the true state and pace of progress.
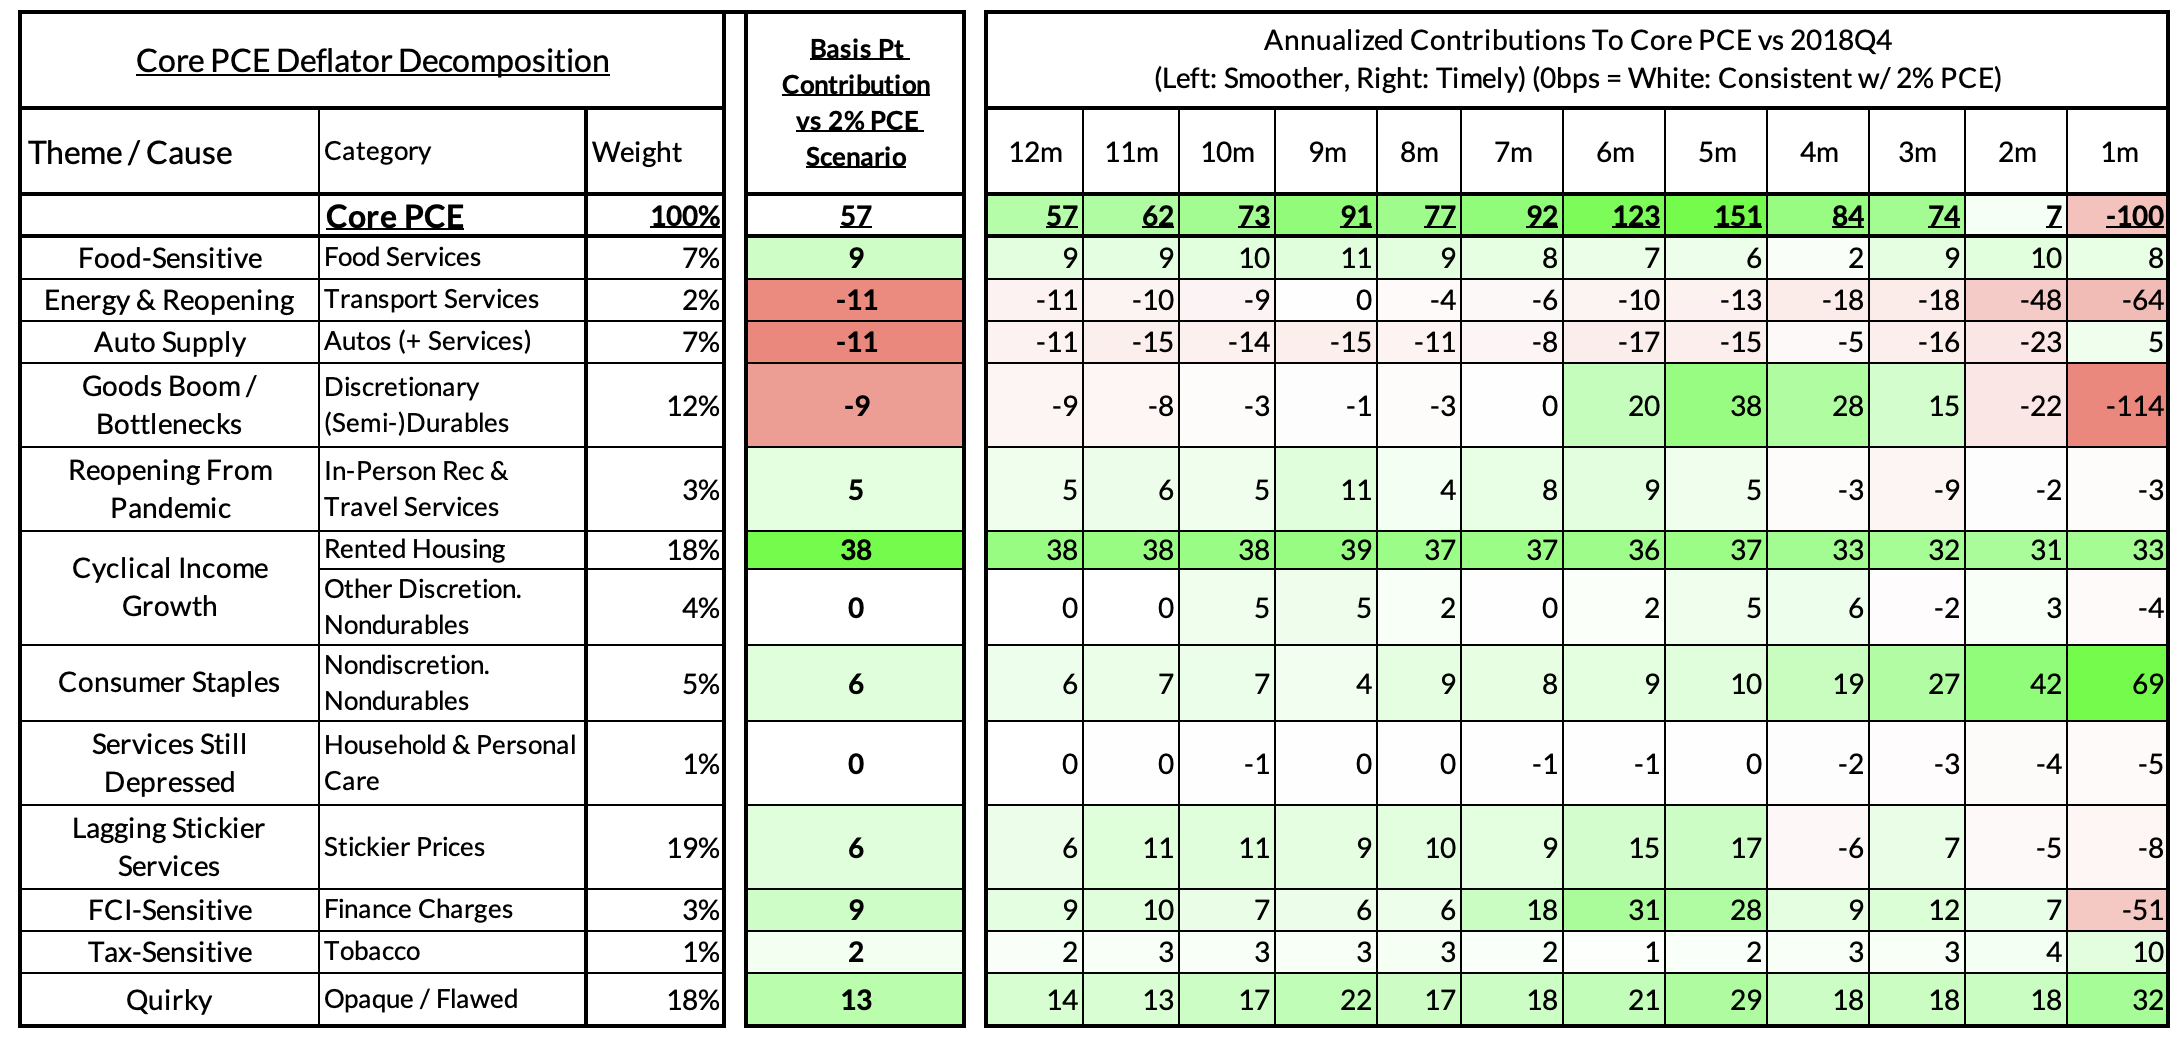
Core PCE Causal Segments vs Target-Consistent Growth Rates


For the Detail-Oriented: Core PCE Heatmaps
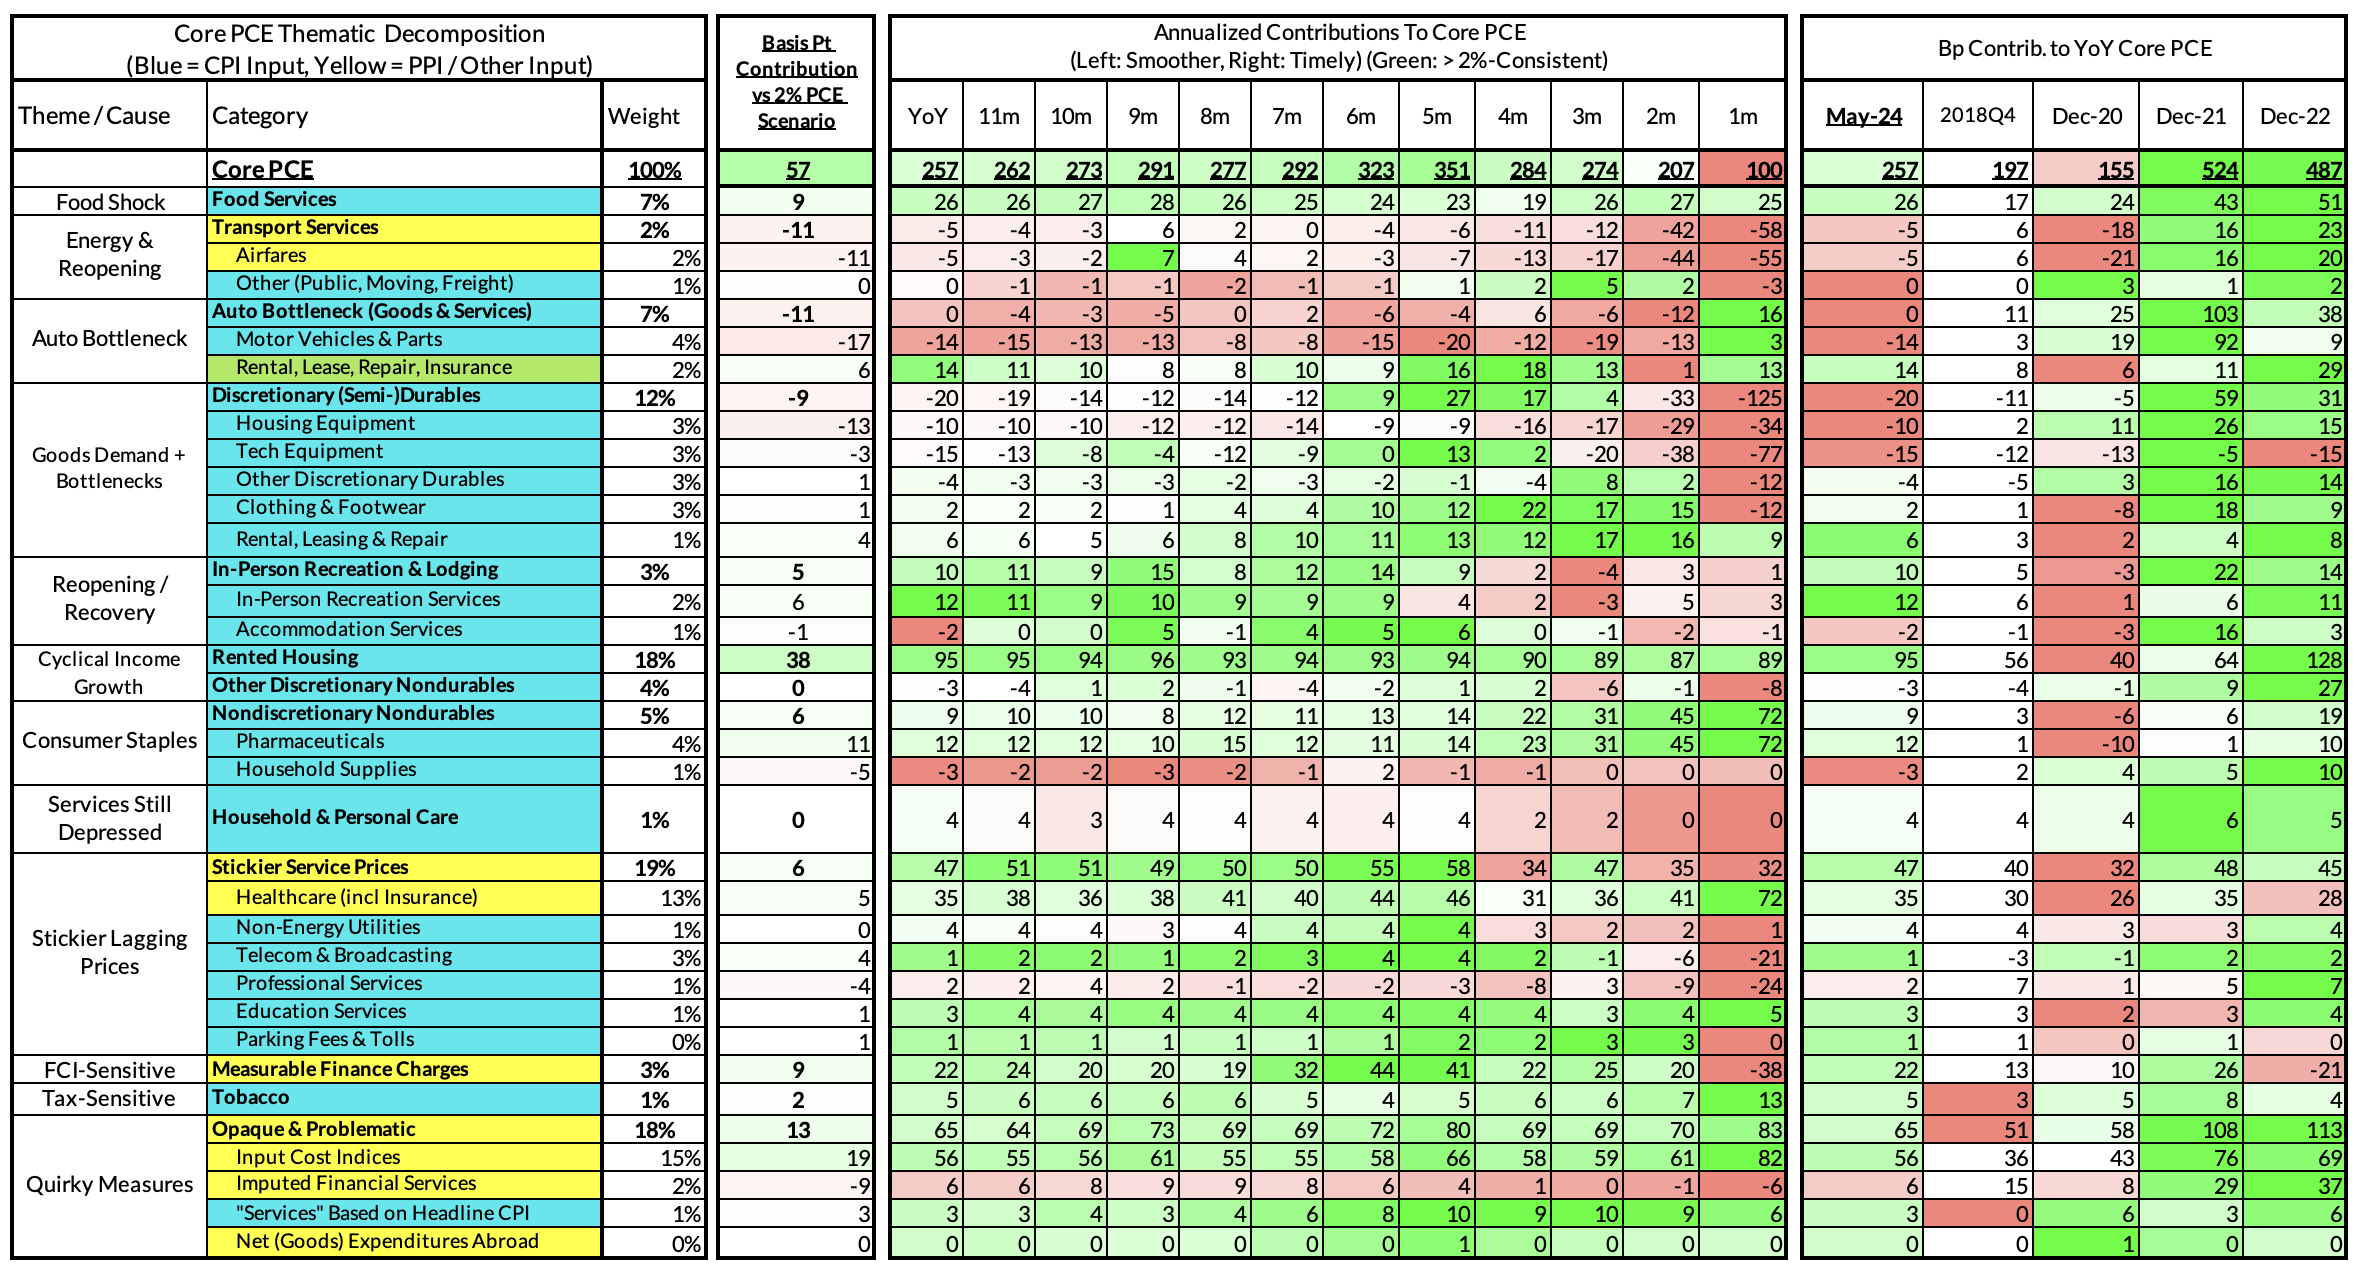
Core PCE (PCE less food products and energy) ran at a 2.57% year-over-year pace as of May, 57 basis points above the Fed's 2% inflation target for PCE. That overshoot is disproportionately driven by catch-up rent CPI inflation in response to the surge in household formation (a byproduct of rapidly recovering job growth) and market rents in 2021-22. Rent is contributing 38 basis points to the 57 basis point core PCE overshoot.
There are other contributors to the overshoot:
- Some more supply-driven (food inputs likely added 9 basis points to the overshoot, motor vehicle bottleneck relief now subtracting 11 basis points)
- Some more demand-driven (in-person recreation and lodging services likely added 5 basis points to the overshoot)
- Some oddball segments have aggravating effects (measured financial service charges now likely adding 9 basis points, while contributions from input cost indices adding 19 basis points to Core PCE vs 2%-consistent outcomes).
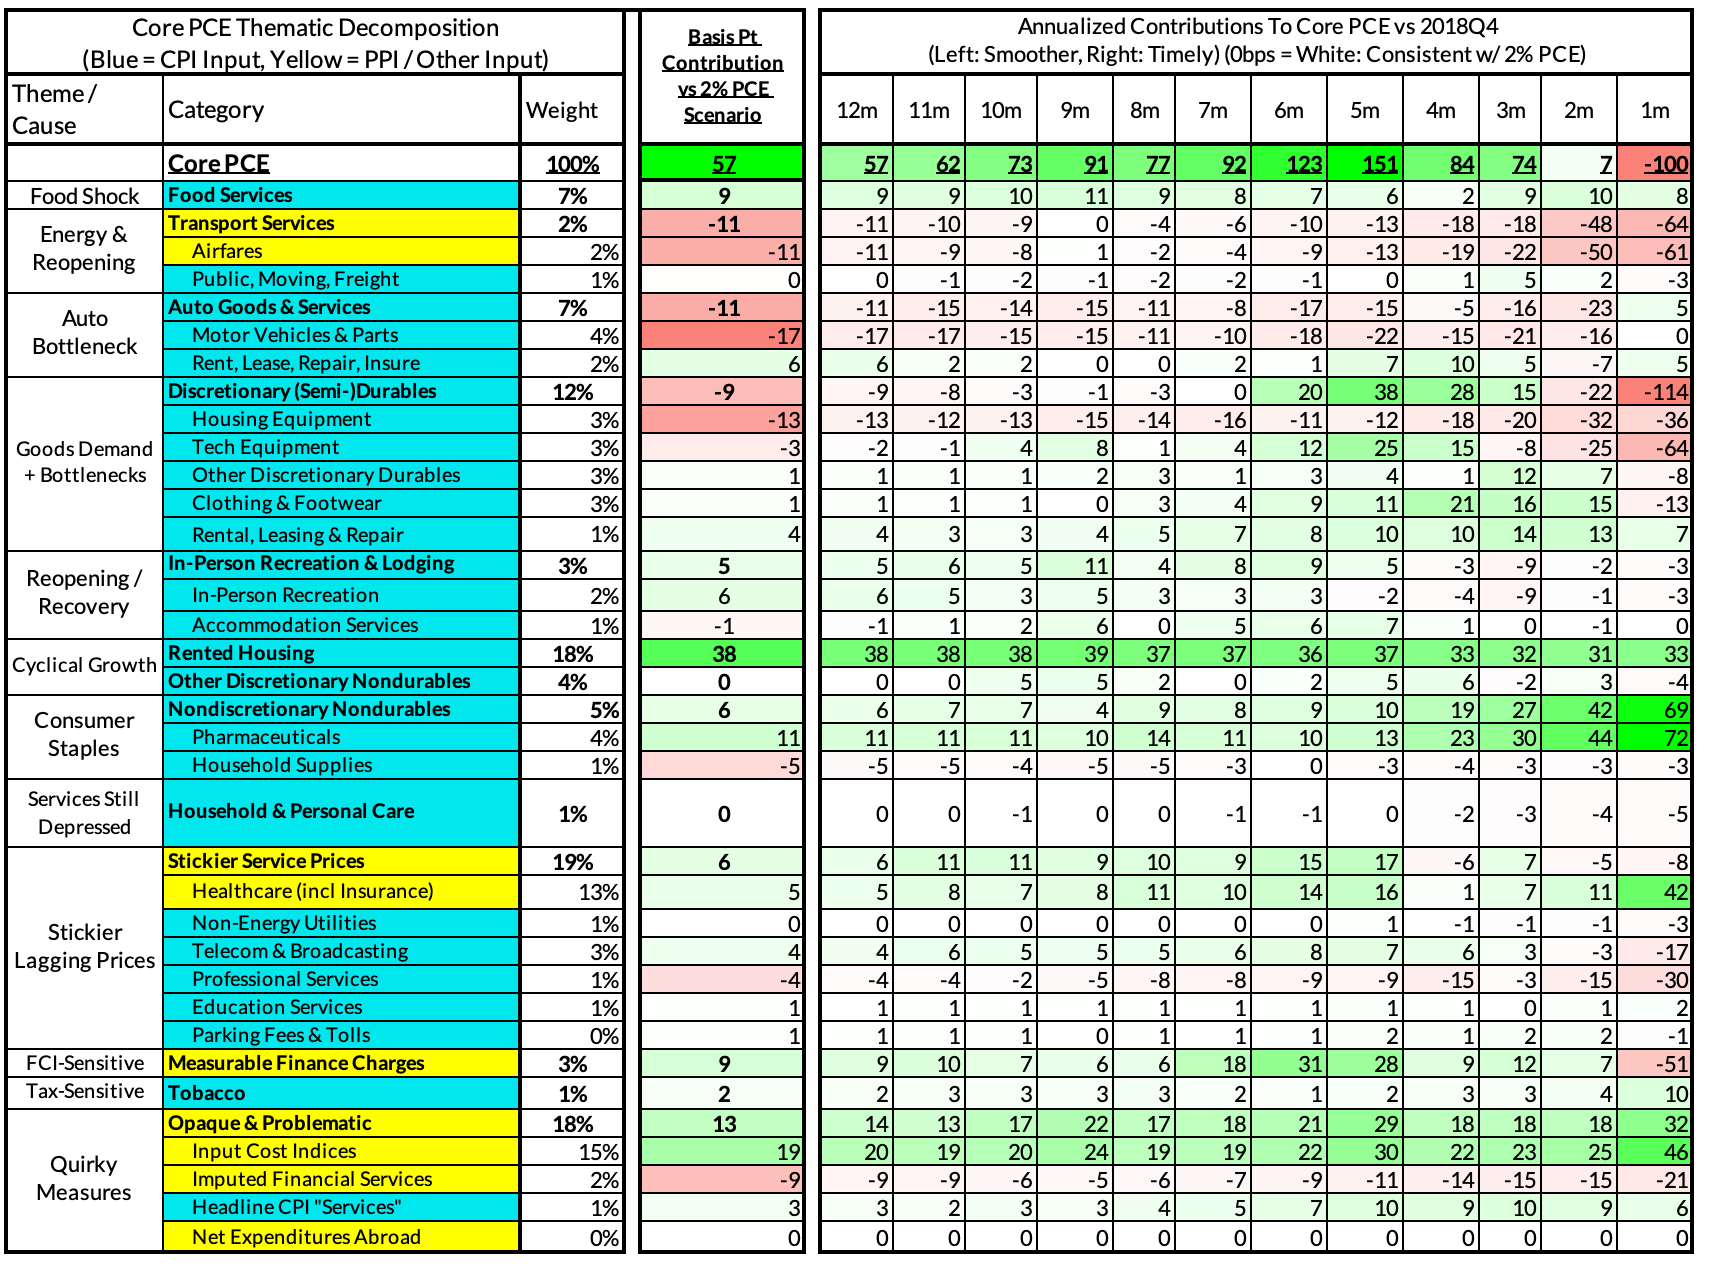
The final heatmap below gives you a sense of the overshoot on shorter annualized run-rates. Monthly monthly annualized core PCE yielded a 100 basis point undershoot vs 2% target inflation (1.00% annualized).
For the Detail-Oriented: Core Services Ex Housing PCE Heatmaps
The May growth rate in "Core Services Ex Housing" ('supercore') PCE ran at 3.39% year-over-year, an 80 basis point overshoot versus the ~2.59% run rate that coincided with ~2% headline and Core PCE.
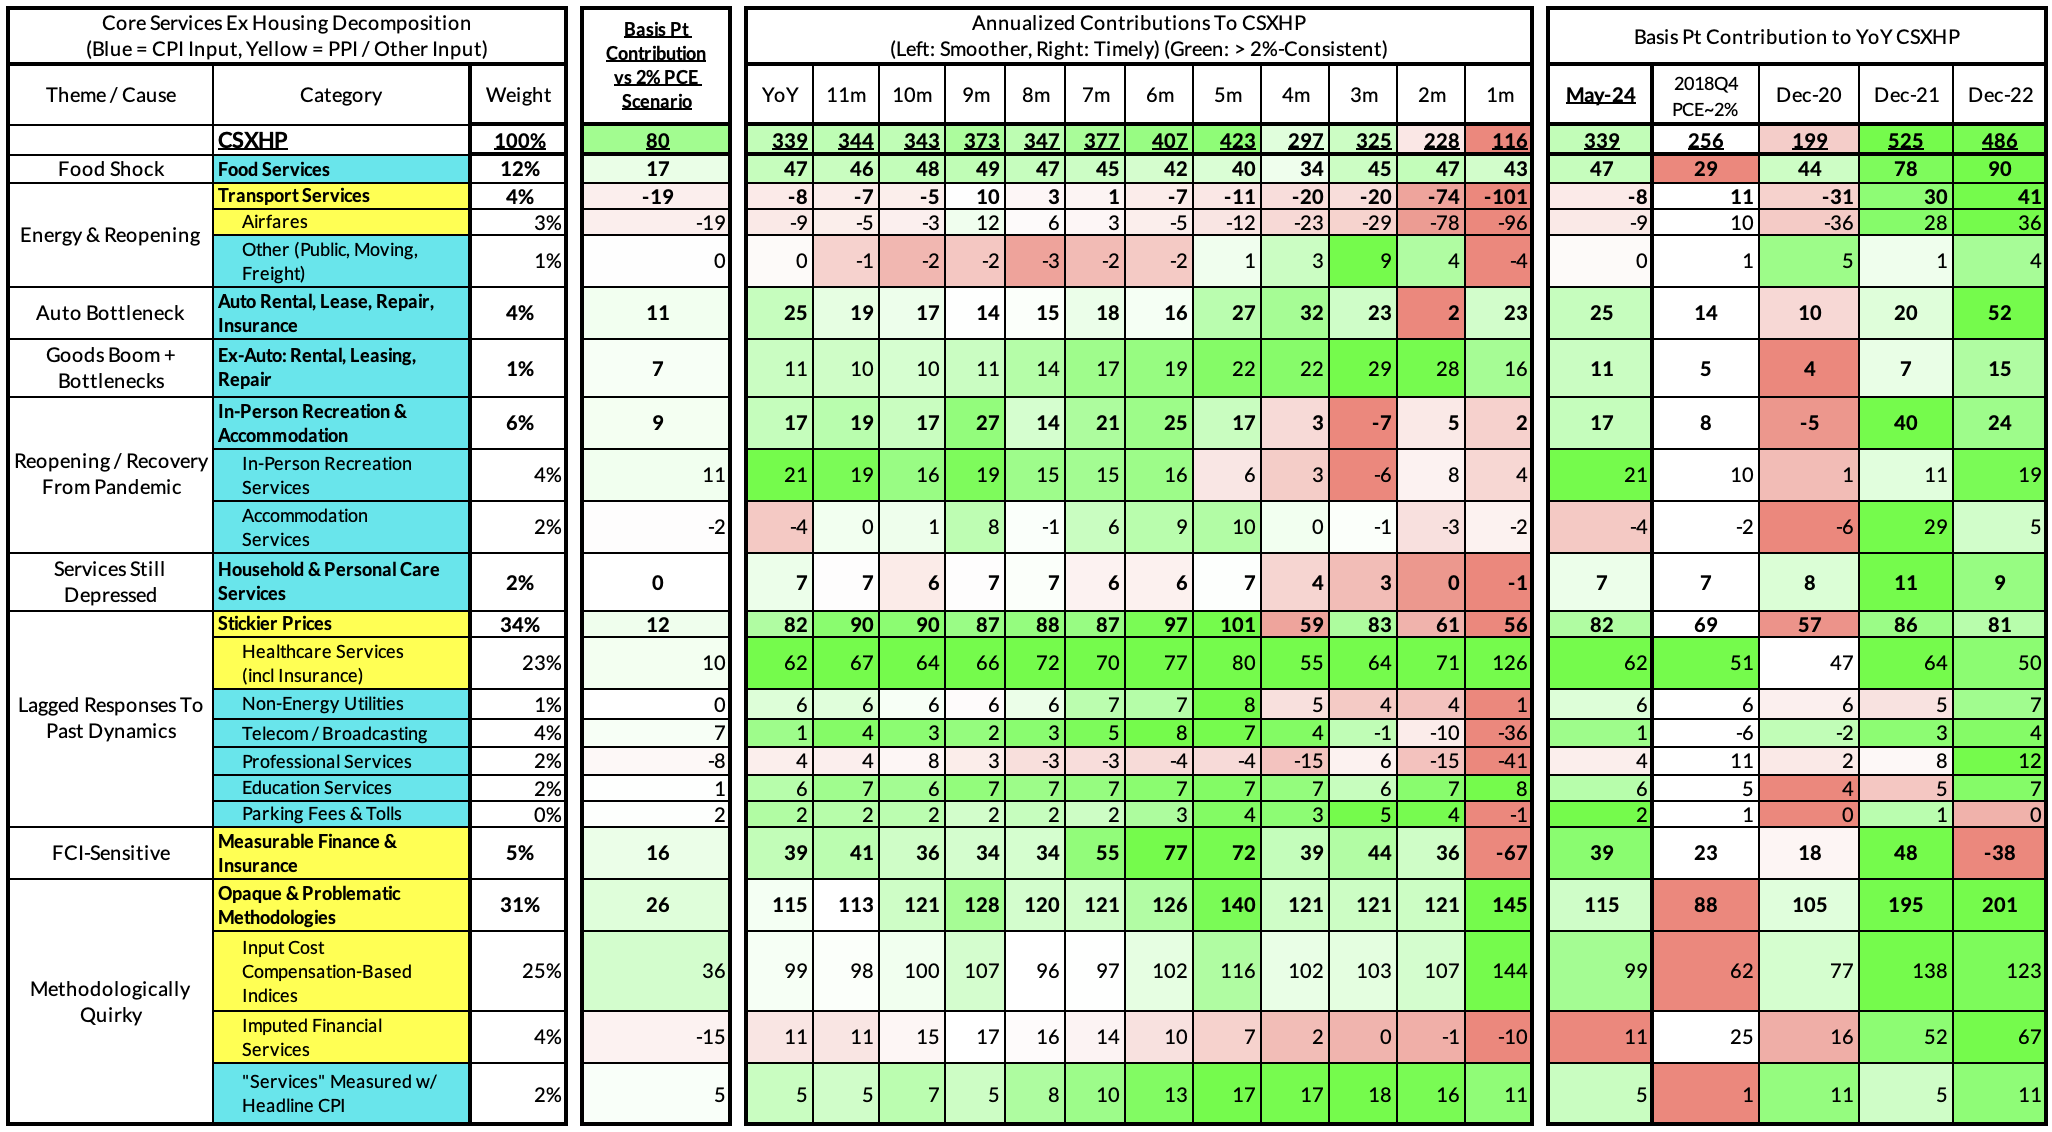
April monthly supercore ran at a 1.16% annualized rate, a 142 basis point annualized undershoot of what would be consistent with 2% headline and core PCE.
