Make no mistake: this is good news. The Fed has made a commitment to not allowing the labor market to deteriorate further, and we’d rather not see that commitment tested.
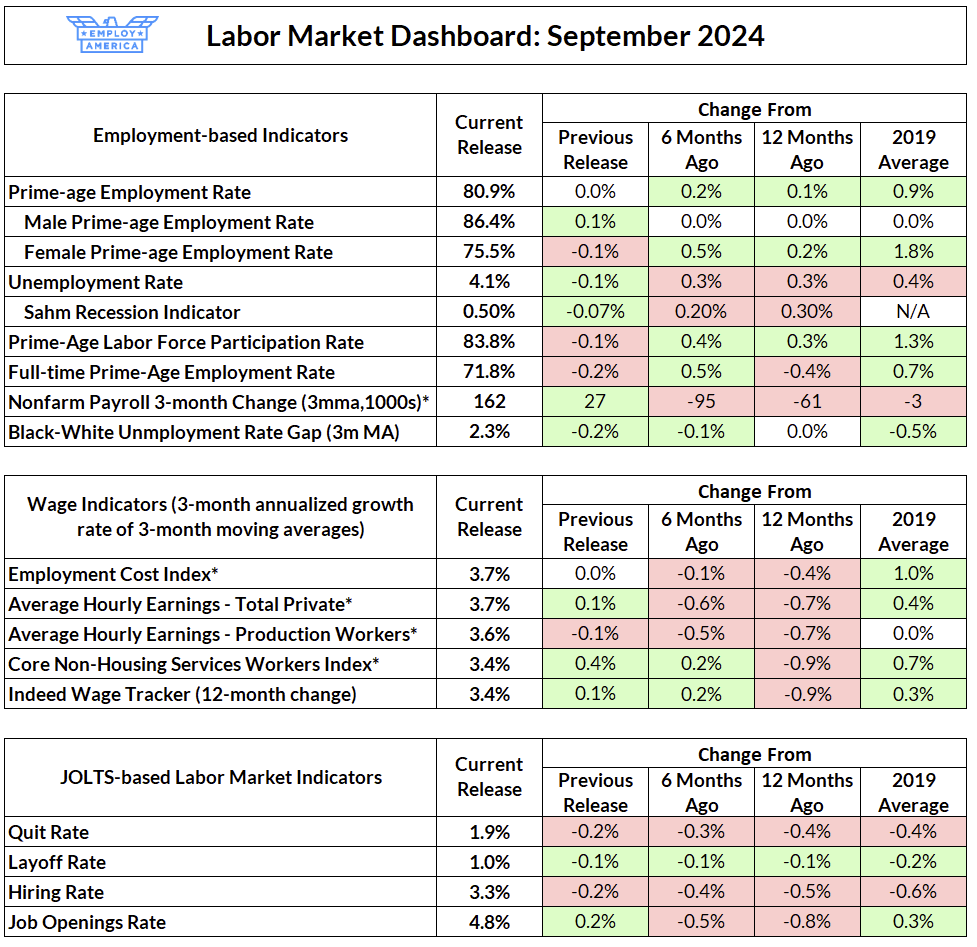
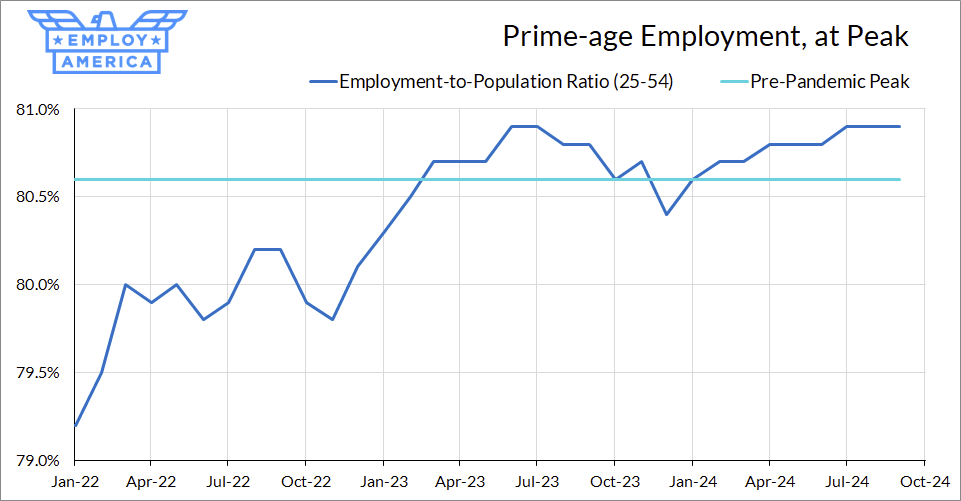
The labor market added 254,000 net jobs in September, with positive revisions (+55,000 and +17,000 in July and August, respectively). The unemployment rate fell by 0.1% to 4.1% (the unrounded unemployment rate was 4.051%, a hair away from 4.0%). This was a “good” fall in the unemployment rate, with the employment-population ratio ticking upwards and prime-age employment rates flat at 80.9%, the post-2020 peak. Wage growth, while lower than even six months ago, picked up on a year-on-year basis. Average hourly earnings growth grew 4.0% over the year—historically elevated but rationalized by the pickup in productivity.
Any way you slice it, this jobs report is good news. While it is just one month, both the household and employer surveys suggest that the more imminent deterioration that looked like a risk in the previous months isn’t materializing. If sustained in the October report (which the Fed will see the week before the November FOMC meeting), this report reduces the probability of another 50 bp cut. But make no mistake: this is good news. The Fed has made a commitment to not allowing the labor market to deteriorate further, and we’d rather not see that commitment tested.
Source: Bureau of Labor Statistics,Author’s Calculations. Red indicates weaker labor market development; green indicates stronger. *Previous month figures for these indicators refer to the as-reported numbers from the previous month, not the previous month’s figure in the current vintage. For an explanation of why, see thispost.
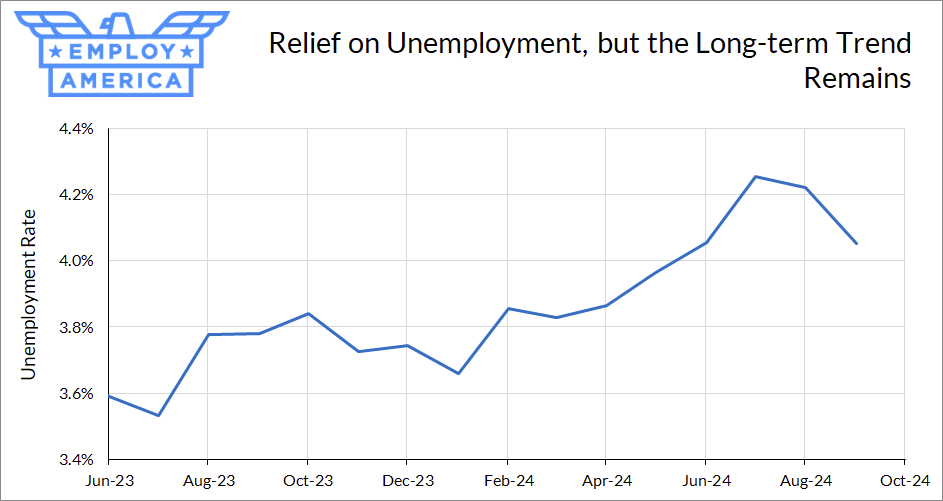
Reversion in the Unemployment Rate
This is a pretty good—but pretty boring—labor market report. While we saw a slowing in the labor market in the previous two months, today’s data provided some relief that this trend may be stalling out or even reversing. This does not invalidate the longer-term story of the labor market slowing over the past 12 months that the Fed used to justify a 50 bp September cut, but it does reduce the left-tailed risk of a recession.
Source: Bureau of Labor StatisticsSource: Bureau of Labor Statistics
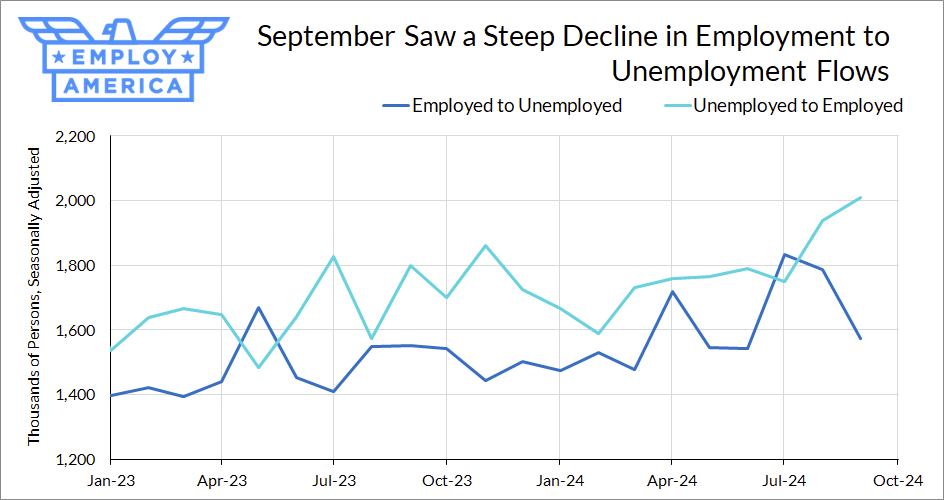
The decline in unemployment was a “good” decline this month—due to an increase in the employment rate, not a decline in the participation rate. Over the past few months, we’ve seen both unemployment to employment transitions rising and employment to unemployment transitions falling. As confirmed by the JOLTS data, a large part of the resilience of the labor market is due to a lack of layoffs.
Source: Bureau of Labor Statistics
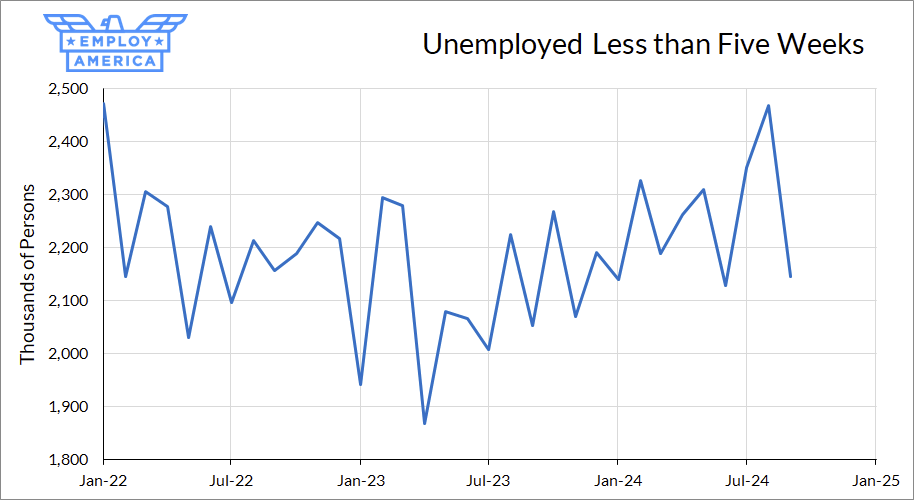
One way to look at this is the number of short-term unemployed people. One can think of this as a proxy for layoffs in the household survey—people who recently became unemployed and haven’t found a job. Over the past year, the number of short-term unemployed has gradually risen, and the previous two months looked like this might be spiking. Luckily, this statistic dropped back to levels similar to the lower levels seen over the past two years.
Source: Bureau of Labor Statistics
This is, of course, just one month of data. But it is an encouraging month.
Why is Churn So Low?
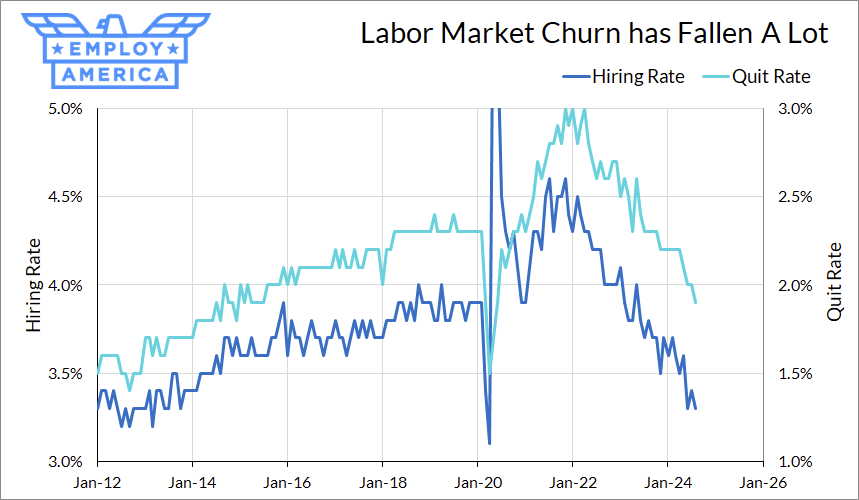
If there’s one weak point to pull out from the labor market data received this week, it’s the drop in quit and hiring rates in the JOLTS data for August. We’re continuing to see a steady decline in quit rates and hiring rates, which are now back to 2014 levels.
Source: Bureau of Labor Statistics
In other words, the “Great Stay” continues, where firms aren’t really looking to get rid of workers, but also aren’t in a hurry to hire new workers. One interpretation of the low hiring and quit rates is simply that labor demand is weak. But another hypothesis—one that I raised as a possibility earlier this year—is that workers are simply well-matched to jobs.
If the Great Stay is at least partially attributable to better matches between jobs and workers, that potentially has profound implications for the trajectory of productivity. One hypothesis that we’ve proposed for why productivity gains tend to follow recoveries to full employment is the “time-to-train” effect: after workers return to employment, it takes them time to climb the job ladder, get trained at their new jobs, and contribute to output.
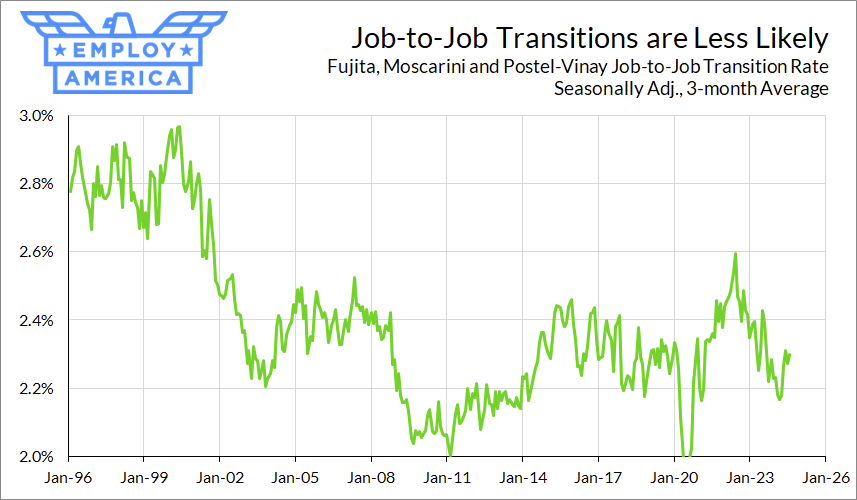
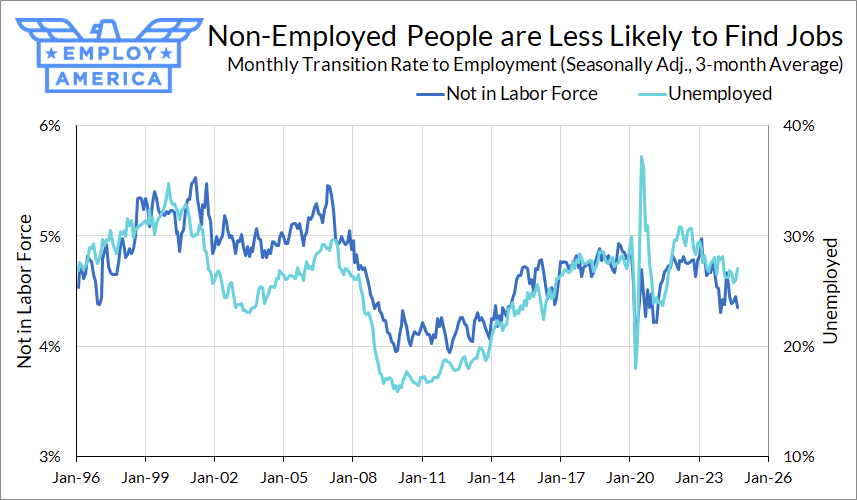
One way to try to get a handle on this phenomenon is to examine job-to-job transition rates and compare them to hiring rates from the un- or non-employed. The logic, proposed by Moscarini and Postel-Vinay (2023), is that low job-to-job transition rates are reflective of both overall labor demand as well as worker-job match quality (if workers are poorly matched, we should expect them to transition jobs more frequently). On the other hand, hiring rates of non-employed workers are more purely a signal of overall labor demand.
Over the past couple of years, both the job transition rate as well as hiring rates from unemployment and those not in the labor force have fallen. This points to a decline in labor demand as part of the story. As for the matching story, it may be too early to tell if the decline in the job transition rate is purely due to labor demand or if there is some improvement in matching that explains the decline. However, an improvement in matching would be consistent with the recent strong performance of productivity, which looks set to continue in Q3.
The Fed
With the drop in the unemployment rate, the likelihood of a 50 bp cut at the November meeting falls. If the labor market continues to look like this at the November meeting, declining to go 50 bp again would likely not jeopardize the Fed’s commitment to cutting off left-tail recession risk—but that doesn’t mean they should rule it out.
We’ll likely see some Fed officials react by saying that the labor market data gives them more time to gradually rate cuts as they feel out the neutral rate and wait for inflation to decline. That’s an understandable reaction, but it’s important to keep in mind that this is still just one month of data and there’s another jobs report before the November meeting.
The link has been copied!
Your link has expired. Please request a new one.
Your link has expired. Please request a new one.
Your link has expired. Please request a new one.
Great! You've successfully signed up.
Great! You've successfully signed up.
Welcome back! You've successfully signed in.
Success! You now have access to additional content.