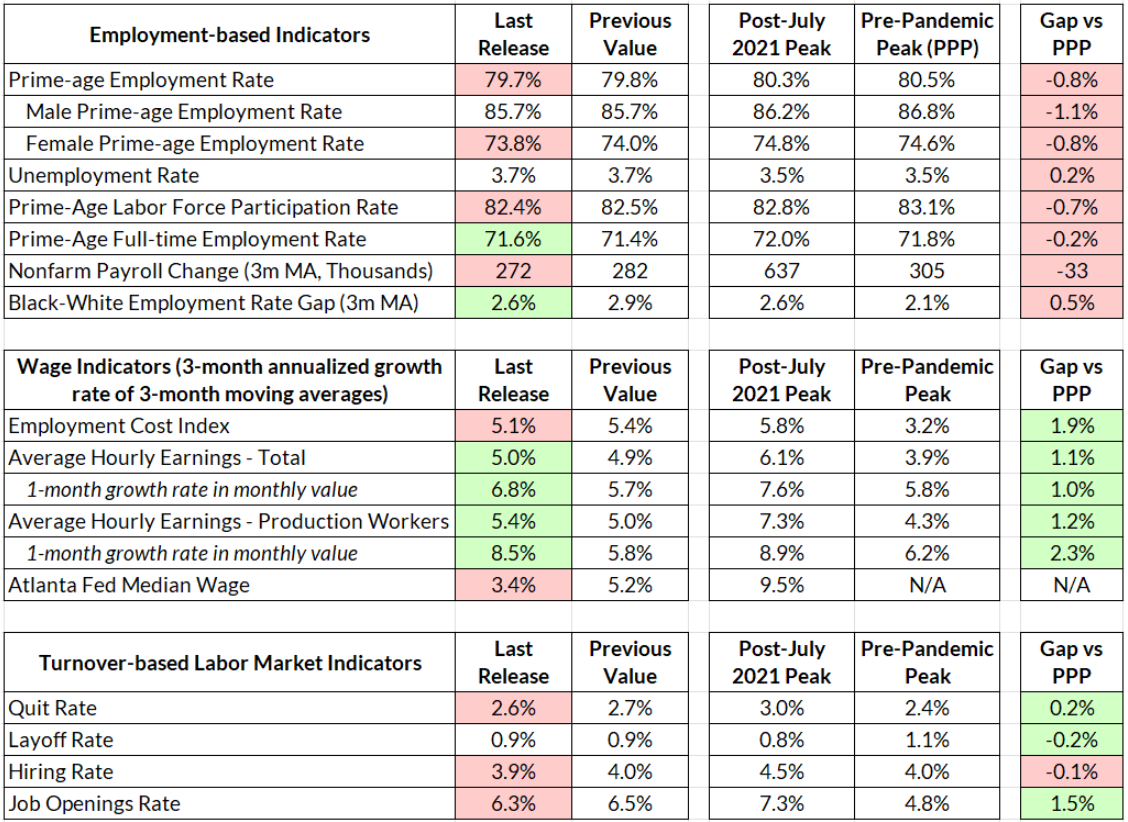
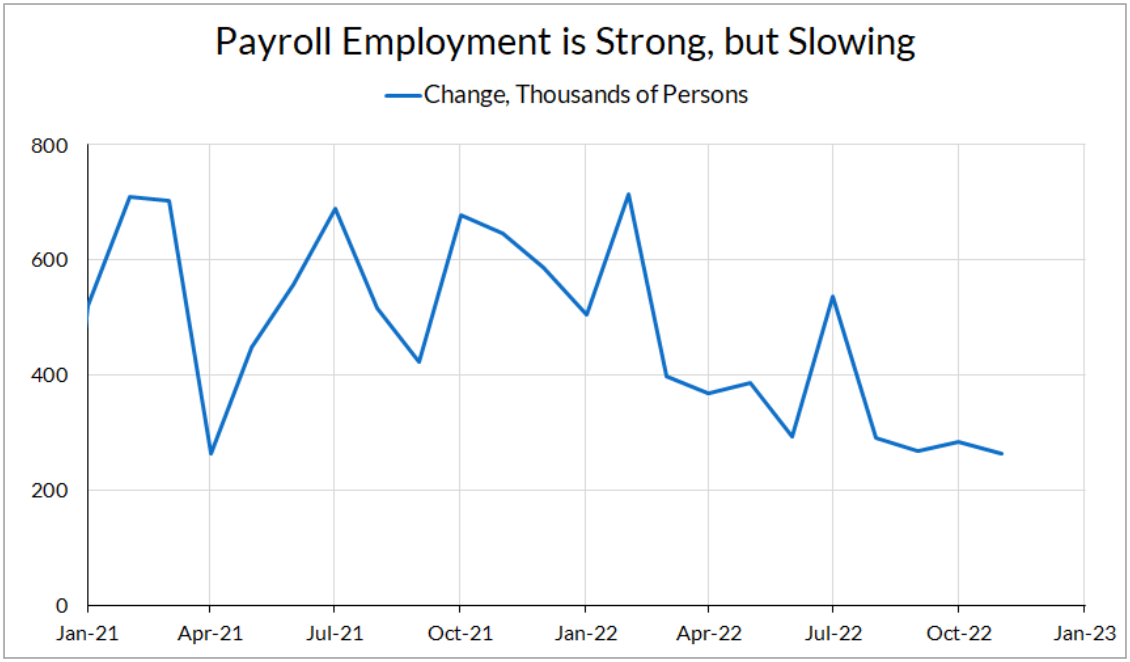
Overall the labor market data from November show a mixed picture, with the establishment survey showing resilience even as the household survey signaling a slowdown. The unemployment rate remains low at 3.7%, and the prime-age employment rate fell slightly by 0.1%, to 79.7%. Meanwhile, the establishment survey showed strong but slowing growth, with an increase in non-farm payrolls of 263,000, above the consensus forecast of 200,000.
On the labor market flows front, all evidence points to a slowdown in hiring without a rise in layoffs. Whether measured through gross flows, changes in unemployment stocks, or JOLTS data, there doesn’t seem to be any pickup in inflows into unemployment, while outflows from employment are stagnant or falling slightly.
Average hourly earnings came in particularly hot in November, increasing at their fastest monthly pace this year. This bucks the trend of wages steadily slowing over this past year that various measures have shown. The rise will surely raise concerns among FOMC participants, but issues with this measure should give pause to those putting too much weight on short-term changes in this figure.
Average hourly earnings are derived by dividing ‘total dollars spent on payroll’ by ‘total hours worked’, so noisy movements in hours worked are reflected in average earnings. For example, elevated workplace absences due to illness can drag on hours worked while keeping aggregate payroll expenditures elevated, thereby causing average earnings to spike. Sectoral inflection points—like the recent contraction in transportation and warehousing employment—can also lift average earnings if low-wage workers are disproportionately let go. Better to wait for Q4 Employment Cost Index (ECI) data, or other indicators that do a good job of forecasting the ECI out-of-sample.
A Tale of Two Surveys
November’s report continues the mystery of diverging evidence from the household and establishment surveys. The household survey shows a weakening-to-stagnant labor market, with prime-age employment and participation rates falling slightly. The establishment survey, on the other hand, shows continuing growth in employment, albeit at a slower pace than last year.
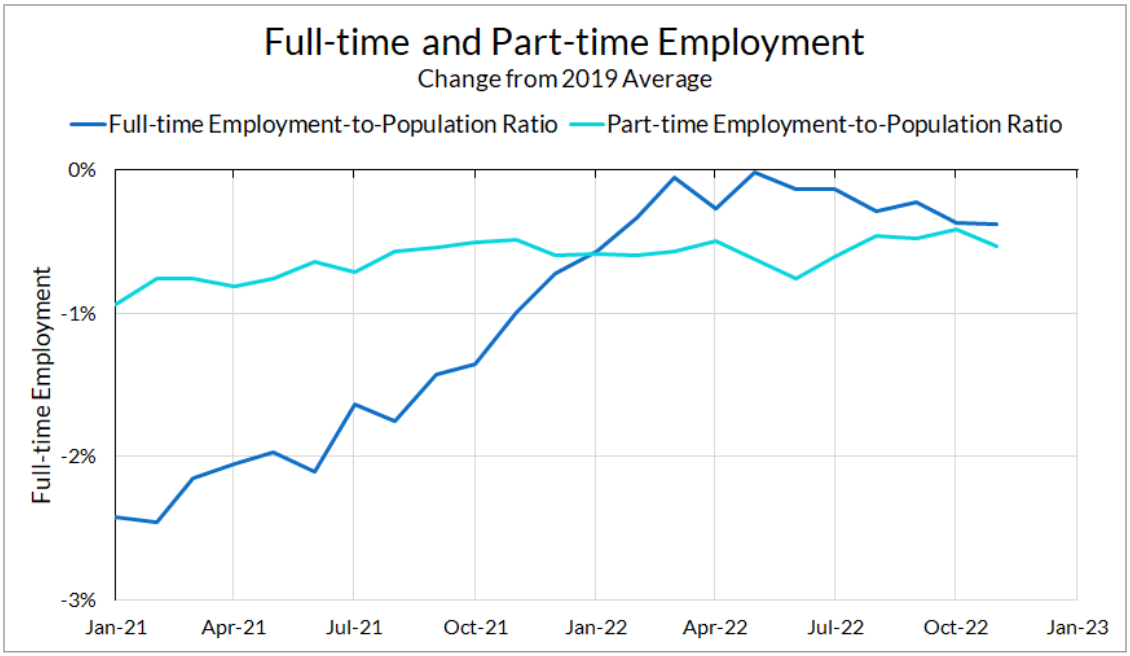
One bright spot in the fall in employment in the household survey is that it is driven mainly by part-time employment. By the beginning of this year, full-time employment mostly recovered its losses from the pandemic but we’ve seen some backsliding on this measure since then. November’s data sees a welcome pause in this decline, and prime-age full-time employment is up slightly, from 71.4% to 71.6%.
A Hiring Slowdown, but No Spikes in Layoffs
One thing to keep a careful eye on over the coming months are the flows in and out of unemployment. One way of thinking about unemployment is the “bathtub” model, where the number of unemployed are determined by inflows (e.g. layoffs) and outflows (e.g. hires).
There are a number of ways of estimating the rate of inflows and outflows. One is to use the Bureau of Labor Statistics’ gross flow figures, which report the number of people who were unemployed in the previous month and end up employed in the next month (and vice-versa). Another is the Shimer (2012) method, which accounts for time aggregation issues (someone can be employed, unemployed, and re-employed between surveys) and uses changes in the stock of unemployed and short-term unemployed to infer labor market flows.
From a recession risk standpoint, this is encouraging. Elsby, Hobijn and Şahin (2010) show that recessions, especially severe recessions, generally start with a short spike in the unemployment inflow rate and a persistent fall in the outflow rate. So far there isn’t any evidence from labor market flows that we are entering a downturn, despite headlines reporting widespread tech layoffs.
This story is corroborated by the JOLTS data, which show a slowing rate of hiring but not an increase in layoffs. While the layoff rate has been essentially flat over the past year-and-a-half, the hiring rate has fallen steadily over the past year and is now below its pre-pandemic peak.
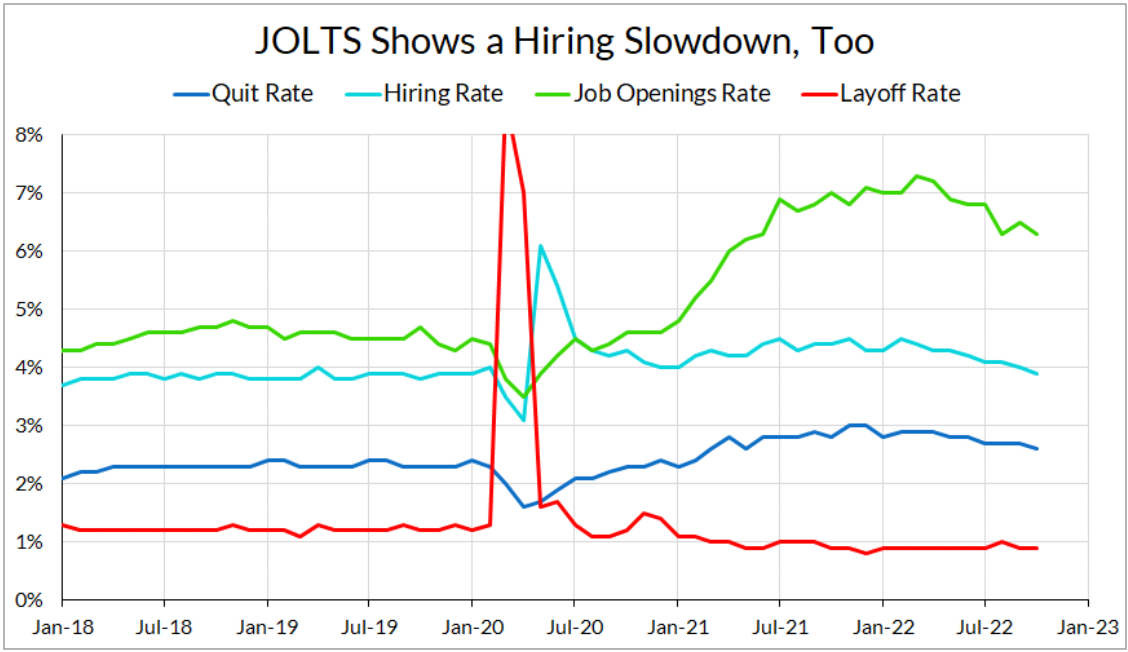
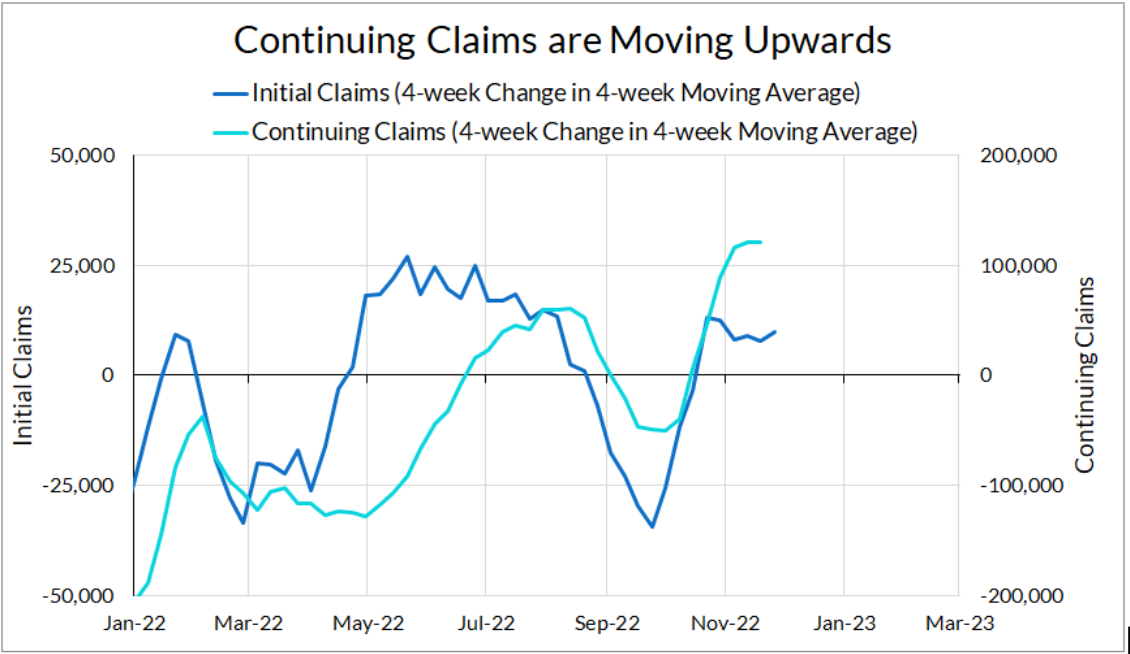
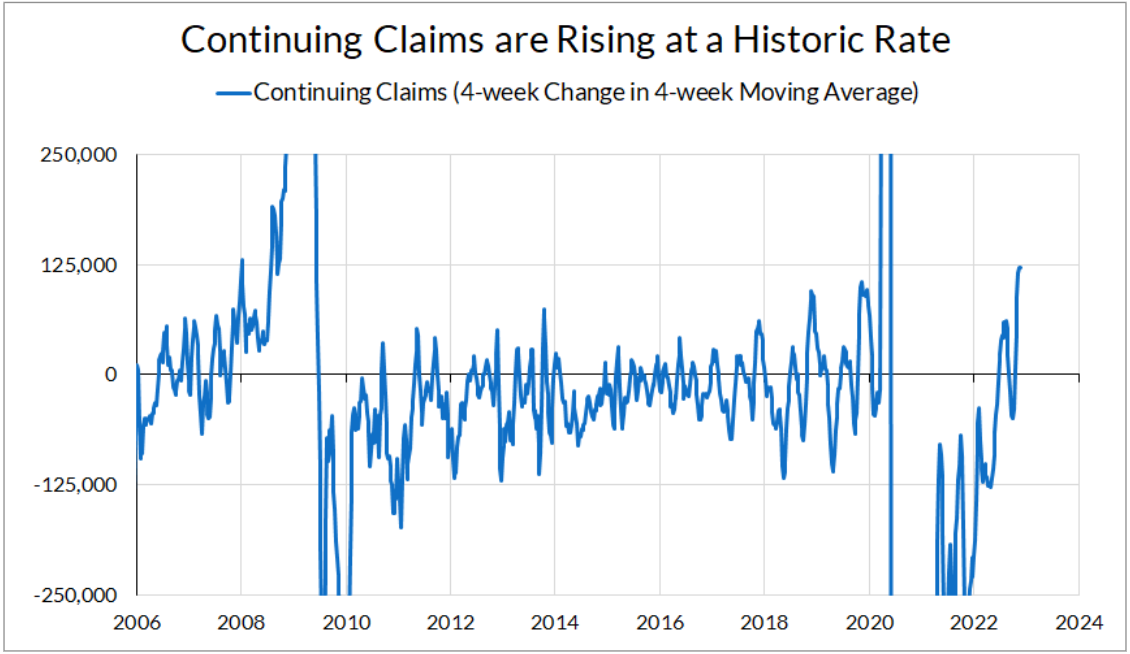
It’s possible that this fall in the hiring rate is to blame for the recent sharp increase in continuing unemployment insurance claims. In fact, continuing unemployment insurance claims are increasing at a rate not seen since the onset of the Great Recession and the pandemic recession. It’s possible that this is noise or being thrown around by seasonal adjustment, but it is a cause for concern.
One Noisy Data Point Towards Hot Wage Growth
One standout in the November Employment Situation Report is the sharp increase in average hourly earnings. Average hourly earnings increased 6.8% for all private workers and 8.5% for production workers on an annualized basis. This increase is an interruption of the gradual slowing of wage growth we’ve seen over previous months.
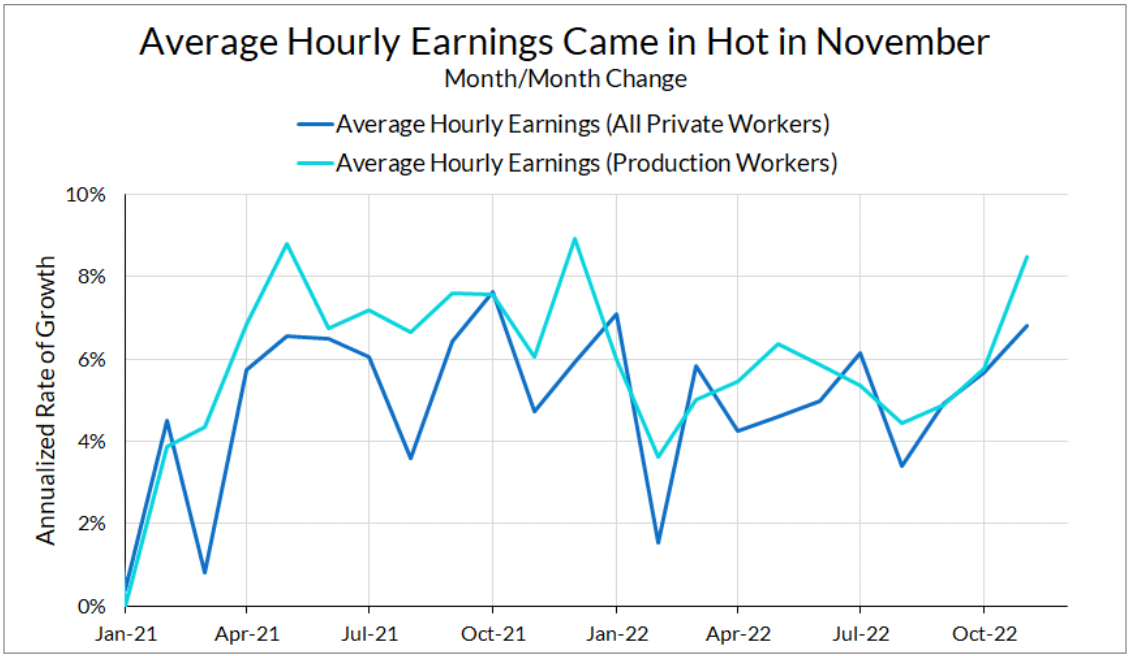
The increase in the average hourly earnings measurement will certainly worry the Fed. It is puzzling given that employment and quits are steadily falling. However, it’s worth noting that the average hourly earnings measurement is not a particularly high-quality measurement of wages, and can move around because of changes in hours (which fell in this report), absences due to sickness, employment composition, and even severance pay.
Other measurements of wages have also shown a gradual slowing over the past year. We’ll have to wait for these higher-quality measures to come in to get a clearer picture of what is happening with wages.
Overall, the labor market looks a lot like it’s normalizing from the pandemic and reopening shocks, and not necessarily in a way that leads to recession. The one outlier in this story is the high increase in average earnings in November, but we should be cognizant of the fact that this is one month’s worth of noisy data. However, we have yet to see the full effects of the Federal Reserve’s interest rate increases, and we should be on the lookout for signs of further deterioration in the coming months.
