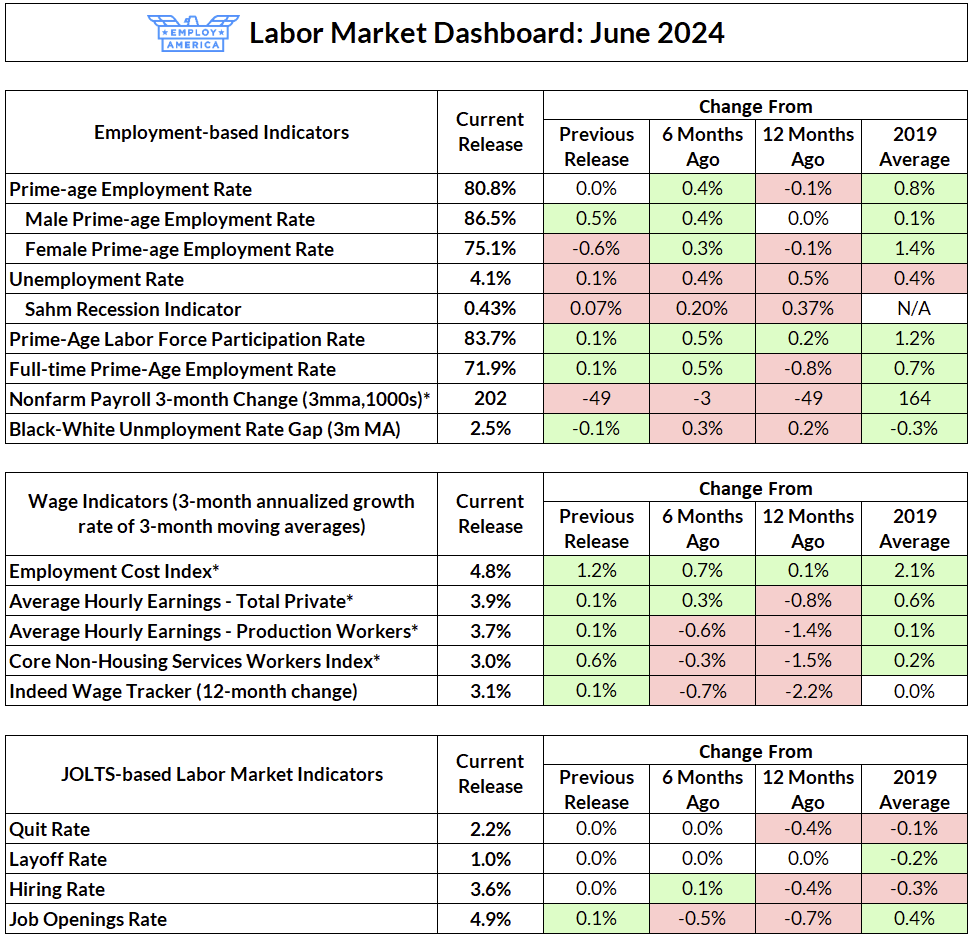
The labor market added 206,000 net jobs in June, with negative revisions of -57,000 and -111,000 to April and May, respectively. The headline unemployment rate increased slightly by 0.1% to 4.1%; the Sahm statistic is now 0.43, just shy of its 0.5 recession indicator level. Prime-age employment rates stayed at 80.8%, just off its post-2020 high. After surging over the past few months, prime-age women’s employment fell by 0.6 percentage points this month while prime-age men’s employment increased by 0.5 percentage points (and is now finally above its 2019 average). Prime-age labor force participation continued to climb, hitting a new high of 83.7%. JOLTS measures were mostly unchanged from the previous month.
We are debuting a new format of the labor market dashboard this month, comparing this month’s readings to the previous release, 6 months ago, 12 months ago, and the 2019 average. The labor market, while still as good or stronger than the 2019 average, is markedly weaker than it was 12 months ago. While the changes in this month’s data were mostly marginal, it is further confirmation of the longer-run trend we’ve seen: there has been significant cooling of the labor market. With all of the softening in the labor market, it’s time for the Fed to actively discuss starting the process of rate normalization.
Five Ways the Labor Market has Slowed
1. The Unemployment Rate has Risen
In early 2023, the unemployment rate reached its lowest level in over fifty years, falling to 3.4%. Since then, the unemployment rate has steadily increased and now sits at 4.1%. The Sahm recession indicator—the change in the 3-month moving average of the unemployment rate from its lowest point the previous 12 months—is getting worryingly close to the 0.5 threshold that Claudia Sham proposed as a trigger for automatic stabilizers.

While the “Sahm rule” is an empirical regularity, there is of course no guarantee that it will continue to hold during this cycle. Do we think that seeing this indicator will rise to 0.5pp is a definite sign that we will see a recession this time around? No—there are enough idiosyncrasies to this cycle (chief among them rising participation) that this time may be different. Do we think it’s a good idea to test that theory by maintaining the current level of restrictiveness while the unemployment rate is increasing? Also no.
2. Payroll Growth Has Slowed
With this month’s data, the 3-month average increase in payrolls is finally below 200,000. Payroll growth is especially weak in Professional and Business Services and Leisure and Hospitality. Temporary employment declined by 49,000, nearly 8% down from a year ago.

The slowdown in payroll growth is even more noticeable if one looks to private-sector growth. Government jobs, which lagged behind in the recovery, have started to pick up. The growth in government jobs is a natural and normal part of working through the pandemic whiplash, but it does mean that private sector labor demand is somewhat lower than implied by the headline numbers.
3. Wage Growth Has Slowed
Like inflation, growth in wages has steadily slowed down over the past couple of years. While there is substantial noise in month-to-month wage growth numbers, if one just looks at longer-run measures of wage growth, it’s clear that any wage-driven impulse to inflation is fading. The 12-month change in wages is 3.9% for overall private average hourly earnings and 3.4% for core non-housing services industries, the area where the Fed believes inflation is most wage-driven. The Employment Cost Index was up 4.2% year-on-year in March, but we will receive a new print for Q2 on the morning of the July FOMC press conference.

If you look at more near-term and leading indicators of wage growth, the slowing is more apparent. The 3-month change in the 3-month moving average of average hourly earnings just below 3.5% (recall that Powell has indicated 3.0 - 3.5% as the range of wage growth that is consistent with 2% inflation). The Indeed Wage Index of advertised wages in job postings—which seems to lead actual wage growth—is just 3.1%.
In other words, the labor market is either at or very close to the point where wage growth should be considered compatible with 2 percent inflation. But just as the Committee has consistently said that they don’t want to wait until actually seeing 2% inflation before cutting, the same should be true for wage growth. Austan Goolsbee agrees:
“And if you’re applying a monetary policy rule, which said, I’m going to keep slamming on the brakes until wages come down to a growth rate that is compatible with 2 percent inflation, you will almost certainly overshoot the target”
Austan Goolsbee, interview with Kyla Scanlon (7/3/24)
4. Full-time Employment Has Stagnated
The full-time employment rate is still more than half a percentage point below its 2019 level. Some of this is attributable to the aging of the population, but the prime-age full-time employment rate is still down from its peak in early 2023.

While some of the decline in full-time employment and rise in part-time employment may be partly due to some workers opting to choose part-time employment over full-time employment because it suits their lifestyle better, at least part of this is due to weakening labor demand. The percent of the population that is part-time for economic reasons has steadily risen over the last eighteen months.

5. Labor Market Churn is Down
Hiring and quit rates have mostly moved sideways over the last six months, but it’s worth stepping back and noting how far quit and hiring rates have fallen from their peak. Both quits and hires are now at or below their 2019 levels.

On the flip side, the layoff rate has basically remained unchanged over the past two years. Taken together, this means that the cooling in the labor market has mostly taken the form of lower churn as job-hopping has decreased. This has also resulted in a slow and steady increase in unemployment, as labor market entrants and those who have lost jobs tend to stay unemployed for longer as they are less likely to find a job.
Historically speaking, stark increases in the unemployment rate are driven (in the beginning) by a short-lived wave of layoffs. So far that hasn’t happened yet. But the question the Fed needs to start asking themselves is, if there is more labor market cooling, can we continue doing it through a further reduction in churn and softer wage growth, or will it at some point take the form of a spike in layoffs?
Some Fed officials are worried about that prospect. Some of this thinking is driven by their believe that we are now on the pre-pandemic Beveridge Curve (see Daly’s most recent speech; Governor Waller is probably also starting to get worried) and at the point where a further reduction in job openings would be associated with an increase in unemployment. While we don’t rely on the Beveridge Curve, the fact that wage growth, quit rates, and hiring rates have fallen so much probably means that we are starting to run out of room to cool the labor market.
It’s Time to Start Preparing for Rate Cuts
Our case for a July cut is simple: since the Fed raised rates to their current level last year, inflation has fallen significantly and the labor market has cooled substantially. It is no longer correct to say that the labor market is overheated. With wage growth now approaching or barely in the 3 - 3.5% range and growth in posted wages even lower, we are starting to run out of room before further labor market cooling puts us short of full employment.
We still have one inflation print between now and the July meeting, and an ECI print the morning of the press conference. We don’t anticipate today’s jobs data to push the Committee towards changing their tone (expect more of the same from Powell at next week’s Humphrey Hawkins hearings) but if we get good June inflation data they should at the very least start signaling that cuts are imminent at the July press conference.