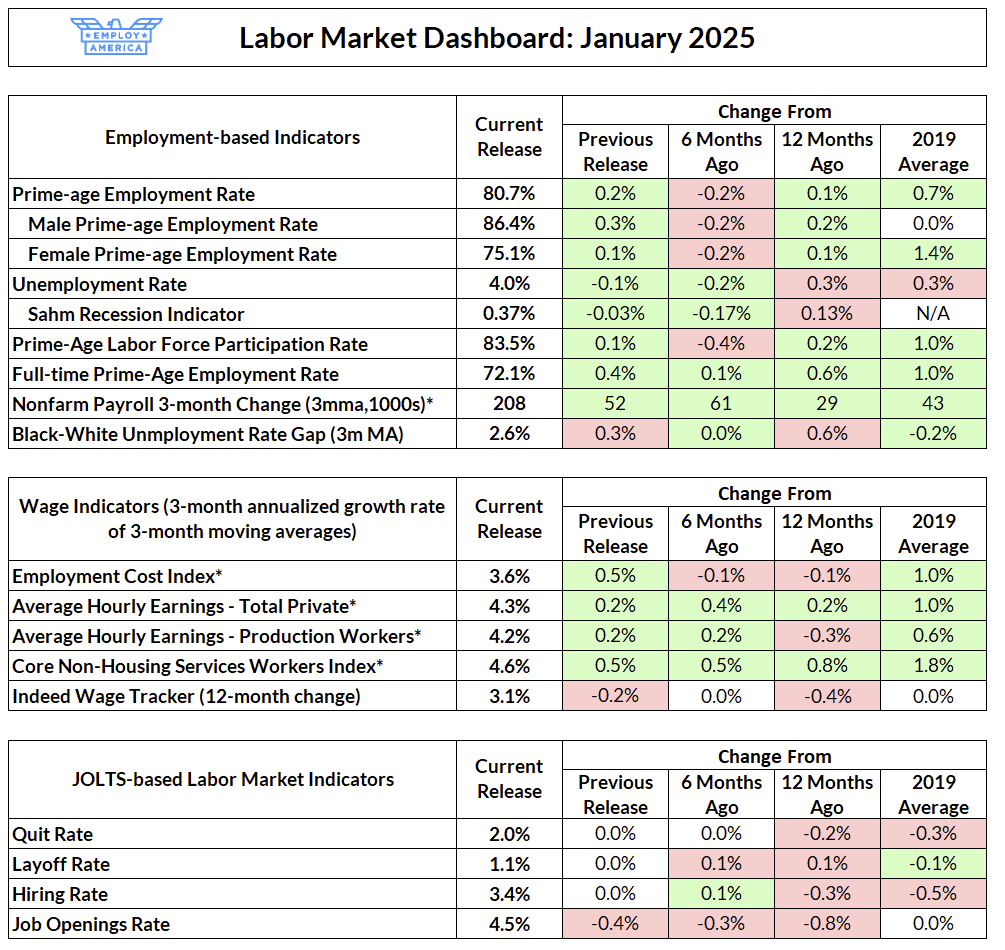
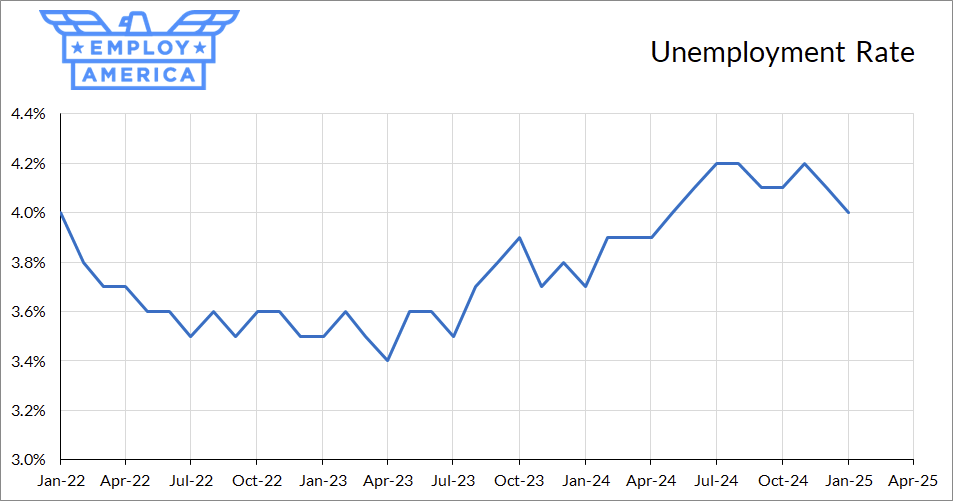
The labor market added 143,000 net jobs in January, with substantial upwards revisions to November and December (+49,000 and +51,000, respectively). The unemployment rate is now 4.0%, reflecting a decrease of 0.2pp (without the new population estimates) and an increase of 0.1pp (due to the new population estimates). Prime-age employment and labor force participation rates rose 0.1pp, mostly due to the new population estimates. Average hourly earnings growth continued to be hot, growing at a nearly 6% annualized rate month-on-month, but the employment cost index came in at 3.6%. Rates of layoffs, quits, and hires all moved sideways; the job openings pop from last month reverted.
As you likely heard, this month brings revisions to the establishment survey and new population estimates for the household survey. There will be headlines about the number of jobs that “appeared” or “disappeared”, but neither of the revisions changes our view of the labor market much. Something to keep in mind is that comparisons of household survey-based measures are not directly comparable between December and January, because the BLS does not retroactively apply new population estimates to previous months. However, notes from the BLS’s news release suggests that the new population estimates only changed ratio-based measures (i.e. employment, participation, and unemployment rates) marginally.
Cutting Through the Revisions Mess
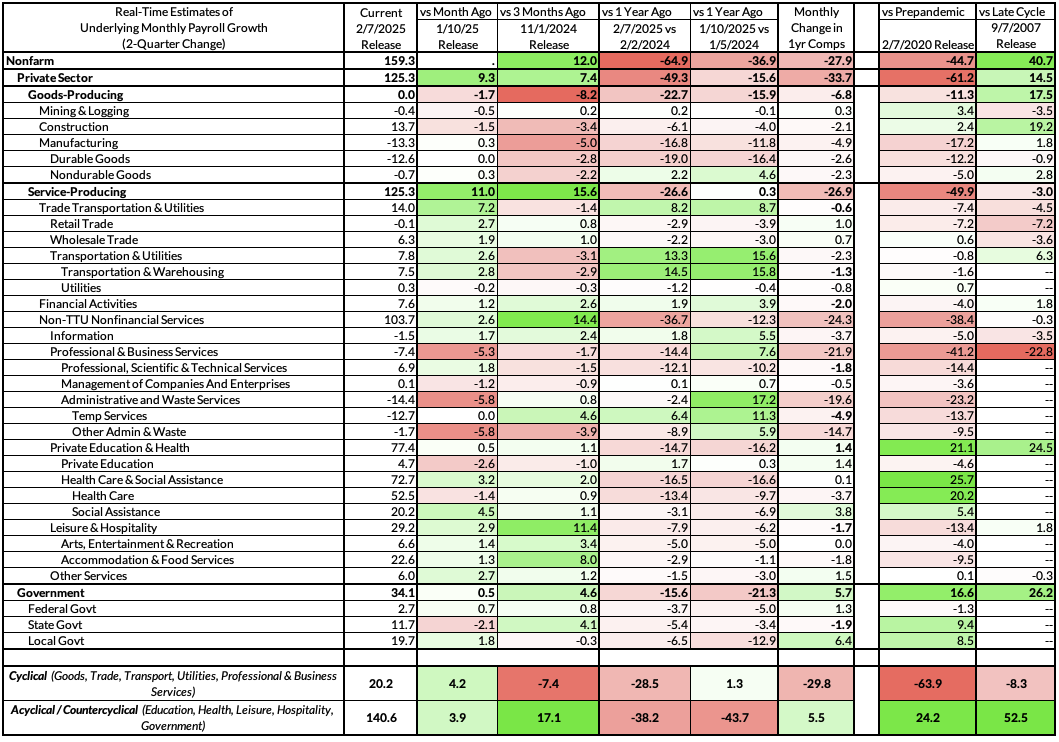
The big story coming into this month’s jobs report were the annual revisions to the establishment and household survey data. Job counts in the establishment survey were revised downwards in March 2024 (the benchmark month) by 589,000 jobs. This is a large revision, historically speaking, but smaller than expected; the preliminary estimate of the benchmark revision was for a 818,000 downwards revision. Monthly job growth in 2024 was revised downwards by just under 20,000 jobs.
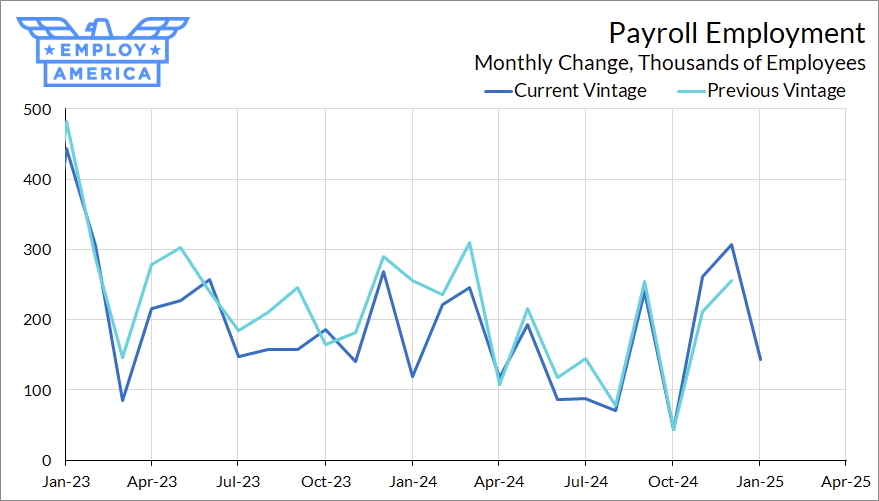
Subscribers to MacroSuite will have seen Skanda Amarnath’s take on how to evaluate the payrolls data when there are revisions left and right: compare data across time as-reported. For example, if you want to think about how your assessment of the labor market should change relative to six months ago, don’t only look at the updated data for six months ago. You should also compare today’s job growth numbers to the ones reported, in real-time, six months ago.
In the chart below, we do exactly that. Here is job growth (the six-month change in the 3-month moving average) in the establishment survey, as reported at the time.
Although the most recent employment prints have been good, the slowdown versus last year is pretty clear. Job growth is about 65,000 jobs slower compared to the data we were looking at when we first got data for January 2024. That being said, job growth does look marginally better in this month than it did in the previous month.
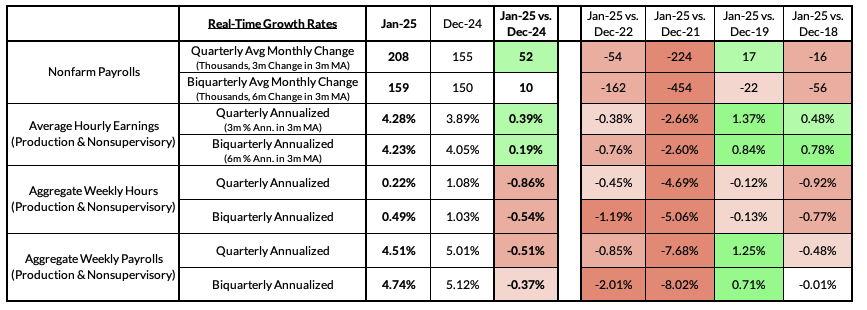
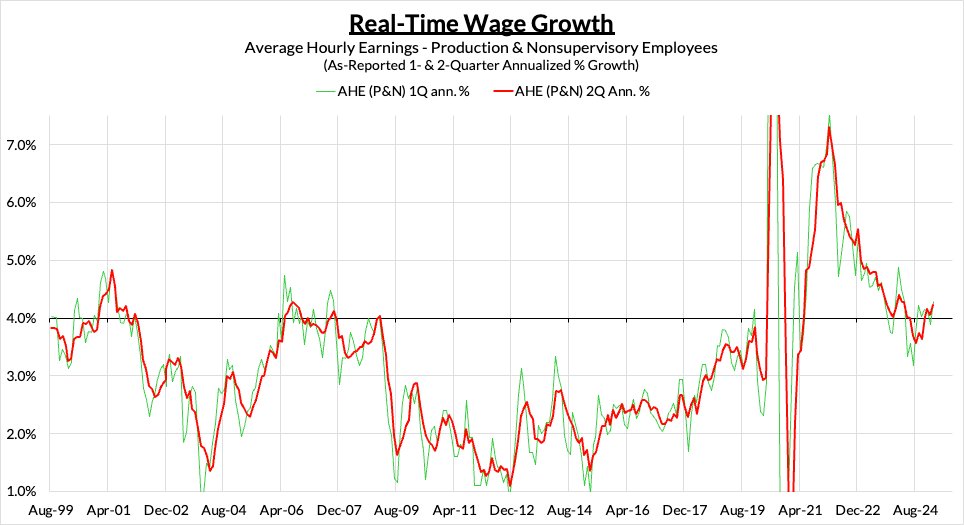
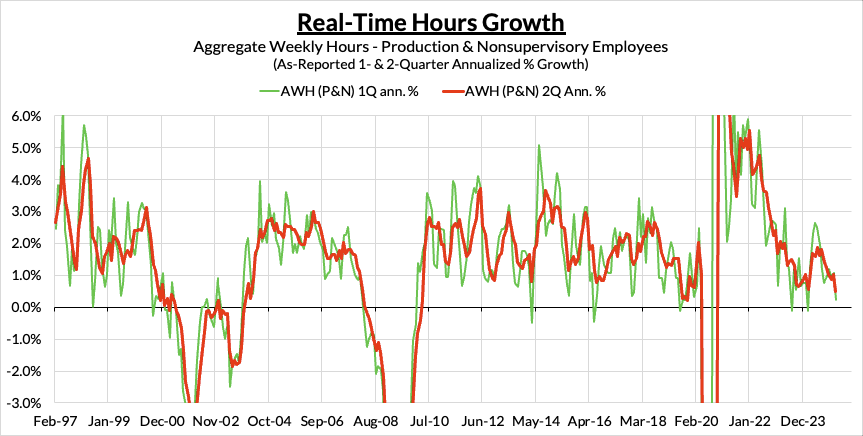
Wage growth in January was also high, but this was coupled with a fall in hours. According to the BLS, wildfires and cold weather did not have a discernible effect on the jobs data, but the underlying sectoral detail suggests otherwise—both the fall in hours and the rise in average hourly earnings is concentrated in private service-providing sectors. It would not be surprising to see this revert next month.
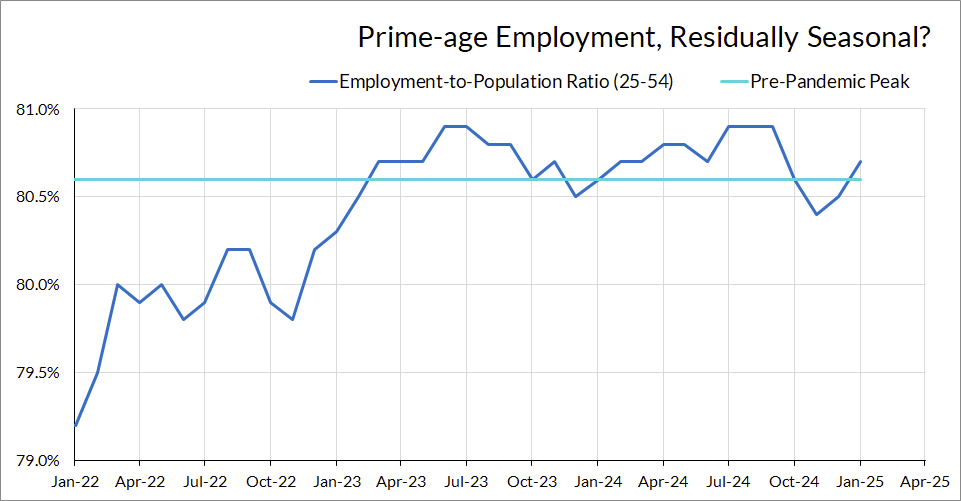
Turning to the household survey, employment rates still look strong. Prime-age employment rates, which had fallen by 0.5pp over two months in November, continue to rebound. The unemployment rate (the rise of which was a major factor in the 50 bp cut in September 2024) has retreated back to 4.0%.
Full-time employment, which had been steadily deteriorating, popped in January. This is a good sign, but it’s also a volatile measure and still remains below 2019 levels.
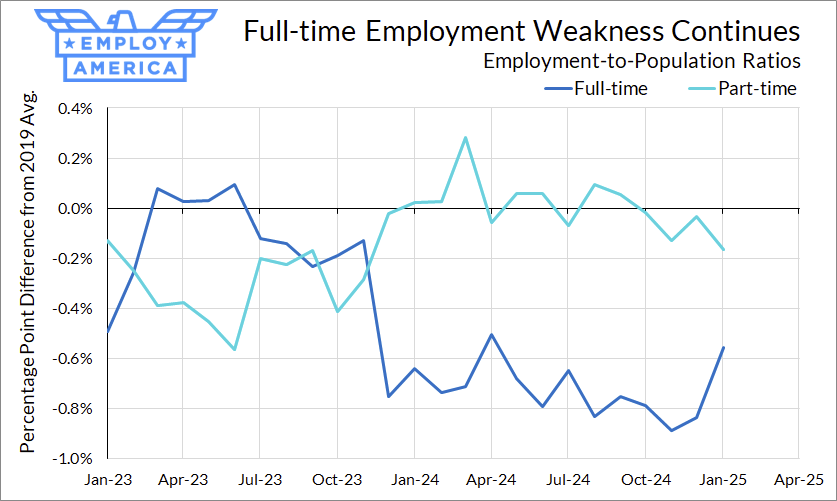
Keep in mind that the household survey is now using updated population estimates and demographics, but prior data is not revised to reflect these new estimates. This means that there is a break in the series for estimates like total employment every January. Even if one uses ratio-based measures like the unemployment, this month’s data is not directly comparable to December 2024’s data, which are calculated using the previous population estimates. That being said, the overall effects of the new population estimates are relatively small. The BLS estimates that the rates of participation, unemployment, and the employment-population ratio all rose by about 0.1pp due to the new population controls.
Job Growth in Cyclical and Interest-rate Sectors is Pretty Cold
Earlier on in the recovery, job growth was primarily driven by sectors considered to be more cyclical and rate-sensitive: construction, manufacturing, trade and transportation, and professional and business services. Later on, job growth in cyclical sectors retreated, and acyclical sectors picked up the lion’s share of job growth.
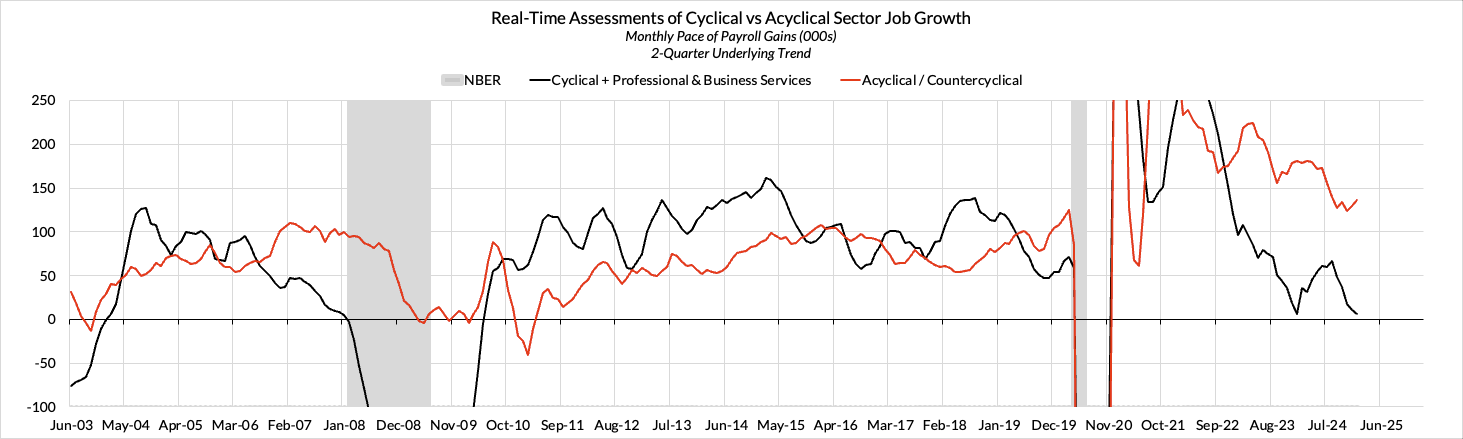
In part, this just reflects a natural rebalancing against pandemic shocks. As lockdowns ended and consumption shifted back towards services, it was only natural that job growth would shift back towards education, leisure and hospitality services. Government hiring is notoriously slow to respond, and only really picked up in mid-2023. However, restrictive monetary policy has now slowed down job growth in cyclical sectors to a crawl.
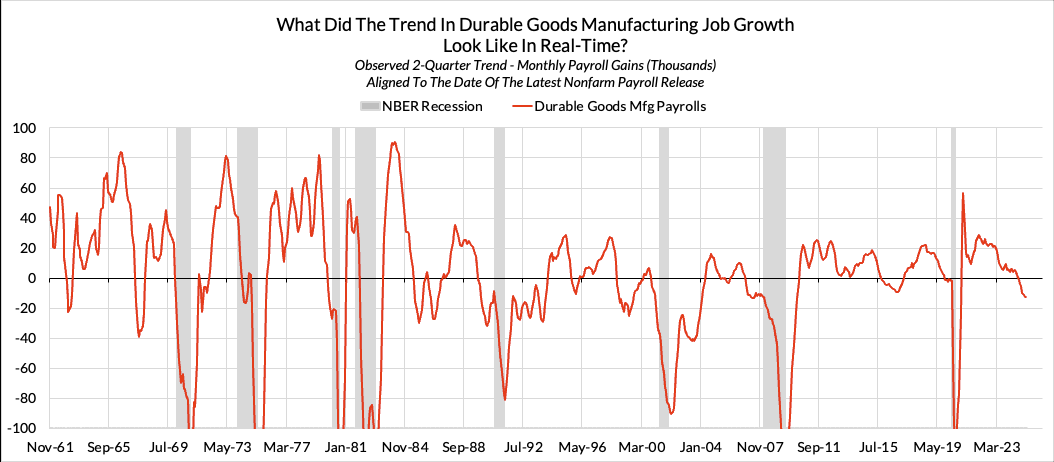
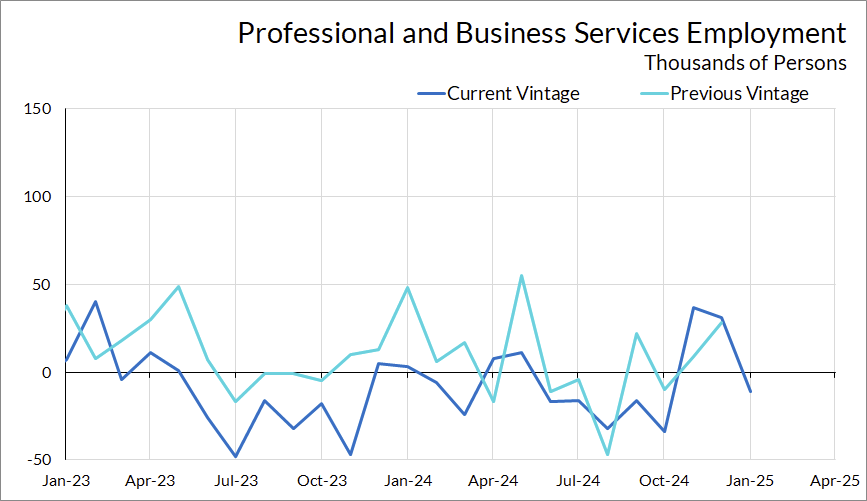
Employment in Durable Goods Manufacturing and Professional and Business Services looks particularly ugly, with outright declines in employment in these cyclical sectors. The fall in Durable Goods Manufacturing employment looks similar to the late-cycle declines seen in the late-1990s and pre-GFC episodes.
On top of the decline in as-reported growth in Professional and Business Services, this sector also accounted for an outsized share of the downwards revisions to the payroll data. Employment in this sector was revised downwards by 316,000 jobs in March 2024, accounting for more than half of the overall revision. The mini-recession in this sector—something we have been tracking since 2023—was starker than previously thought. Employment in this sector, which previously looked like it was moving sideways, has been falling over the past two years. There is a similar dynamic present in the smaller Information sector.
Among the cyclical sectors, the bright spot is residential construction employment, which continued to climb this month. Growth in residential construction employment is enough to offset the fall in durable goods manufacturing employment, but (as we noted last week) the outlook for construction employment is increasingly shaky as the amount of housing under construction continues to fall.
Weakness in Cyclical Sectors Poses a Downside Risk to Further Expansion
The labor market might be solid right now, but the composition of job growth in the future looks increasingly worrying.
Employment in cyclical sectors is held up by residential construction, and should slow in the continuing months. The other major sectors here—durable goods and professional and business services—are seeing outright job losses. The Fed has already signaled a pause in further interest rate reductions, and an increase in policy uncertainty looks like it will only increase the length of that pause. Without a reduction in interest rates, it is hard to see why employment in these sectors would pick up.
Meanwhile, employment growth is concentrated in education, health, leisure and hospitality, and government. Of note, Health Care and State and Local Government, which currently account for over half of the employment growth in the acyclical sectors, is potentially vulnerable to pauses in federal spending.
The Fed has expressed a desire to keep the labor market strong and has communicated that they’ll cut faster than expected if they see the labor market weaken. Most of the discussion around risks discussed are to the upside—what if the Fed has to pause indefinitely, if inflation doesn’t cooperate or if tariffs reignite inflation expectations? However, the Fed may find itself in a situation where its commitment to labor market strength is being tested.