Labor Market Recap August 2024: Enough Weakness for 50 bps in September
Even though today’s report gave back some of the weakness in the July household survey, the reversion was slight. The August report meets the conditions we laid out yesterday for a 50 bps cut in September to play catch-up.
The labor market added 142,000 net jobs in June, with substantial negative revisions (-61,000 and –25,000 in June and July, respectively). The published headline unemployment rate fell by 0.1% to 4.2%, but the unrounded figures are less impressive (a fall from 4.253% to 4.221%). The spike in temporary layoffs seen in July did revert—but the relative flatness of the unemployment rate means that we saw a continued increase in unemployed entrants and reentrants. The Sahm statistic, which crossed 0.5pp last month, rose further to 0.57. Prime-age employment rates remained at its peak of 80.9%. JOLTS quits, hires, and layoffs were little changed, but the job openings rate took a big step down.
By early July (when we had June labor market data), we called for the Fed to cut at the July meeting. Since then, the labor market data has only confirmed that view to us. Even though today’s report gave back some of the weakness in the July household survey, the reversion was slight. The August report meets the conditions we laid out yesterday for a 50 bps cut in September to play catch-up.
Source: Bureau of Labor Statistics, Author’s Calculations. Red indicates weaker labor market development; green indicates stronger. *Previous month figures for these indicators refer to the as-reported numbers from the previous month, not the previous month’s figure in the current vintage. For an explanation of why, see thispost.
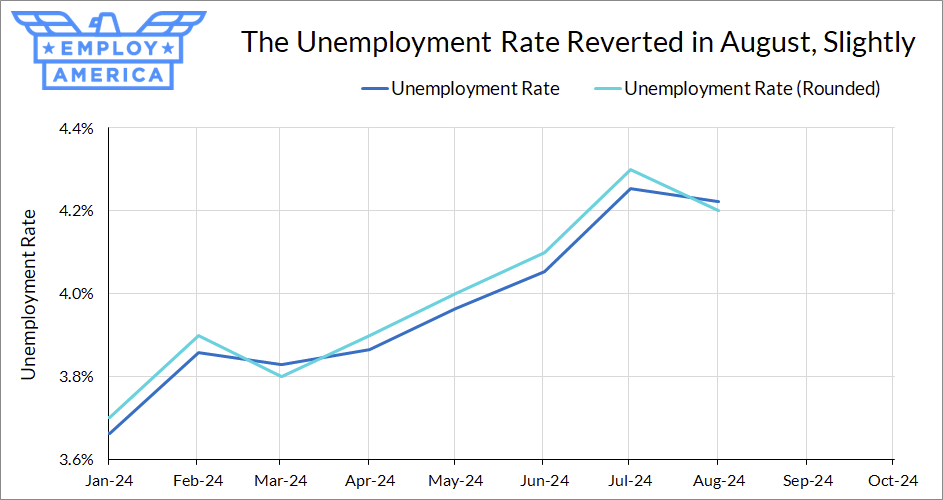
Reversion in the Unemployment Rate... Slightly
Although the published unemployment rate fell from 4.3% to 4.2%, apparently undoing half of the rise in July, the unrounded numbers are less favorable. The unrounded unemployment rate fell by just 0.032pp in August, undoing about one-sixth of the rise in unemployment in July.
Source: Bureau of Labor Statistics
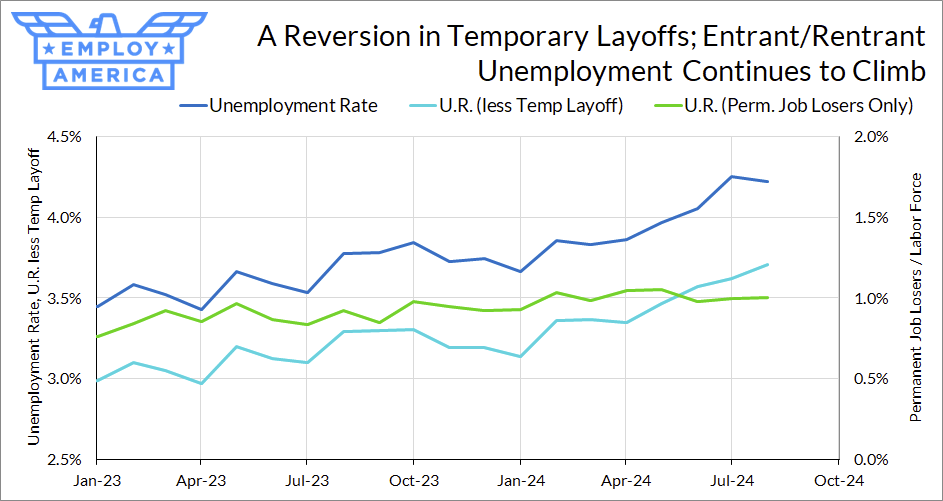
One reason for the spike in the unemployment rate last month was a surge of workers on temporary layoff. Many people (including myself) erroneously attributed this to Hurricane Beryl; the state-level data since then have rejected that idea (many of the temporary layoffs were concentrated in California). Whatever the reason, the temporary layoffs from July have since reverted.
However, the relative flatness of the unemployment rate combined with a drop in temporary layoffs means that unemployment for other reasons continues to rise. The unemployment rate less-temporary-layoff continues to climb, driven by unemployment labor market entrants. Even if we’re not seeing firing pick up, it remains the fact that labor demand is not strong enough to accommodate the rise in labor supply. Of course, this a continuation of the story we’ve been seeing for months.
Source: Bureau of Labor Statistics, Author’s Calculations
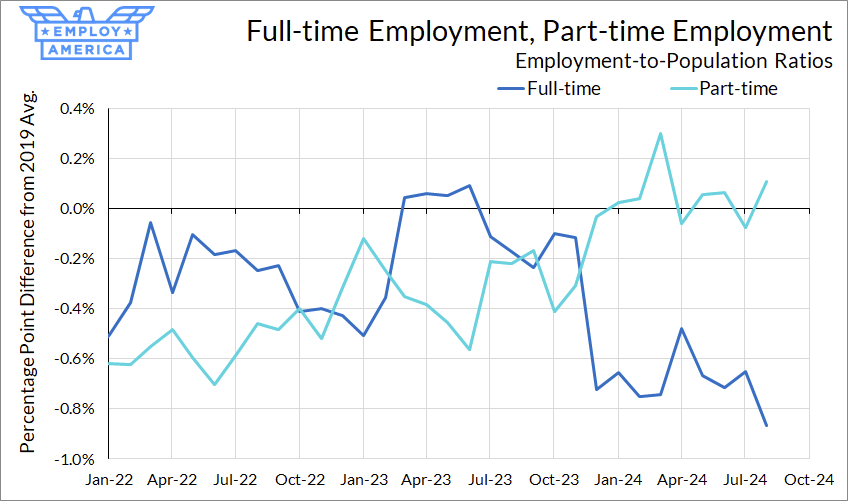
Elsewhere in the household survey, we continue to see weakness in the hours margin of labor utilization. The full-time employment-to-population ratio continued to fall, and is now nearly a full percentage point below its post-pandemic peak. We hoped this would bounce back after falling late last year; if anything, it continues to deteriorate.
Source: Bureau of Labor Statistics
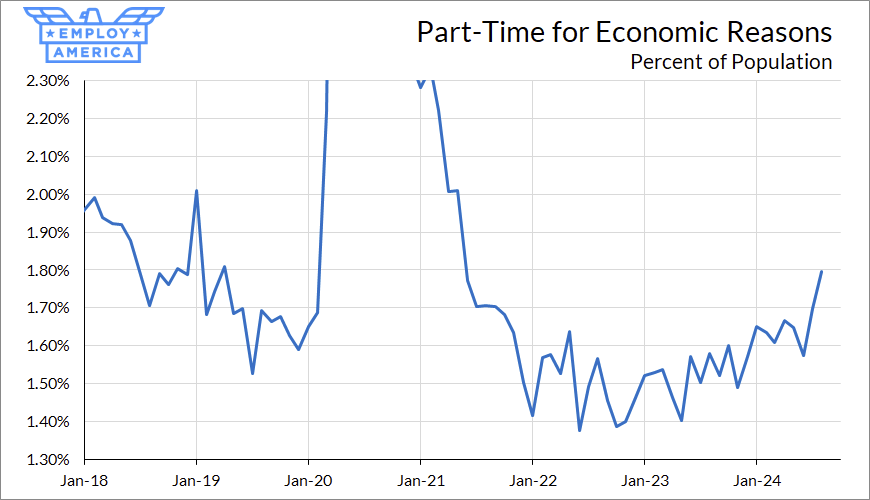
While some of this may be due to changing worker preferences, the surge in the number of workers that are part-time for economic reasons suggests that about half that fall is due to labor demand. The proportion of the population reporting part-time work for economic reasons (insufficient demand) has surged over the past two months, as is now beyond 2019 levels.
Source: Bureau of Labor Statistics
Declining Payroll Job Growth
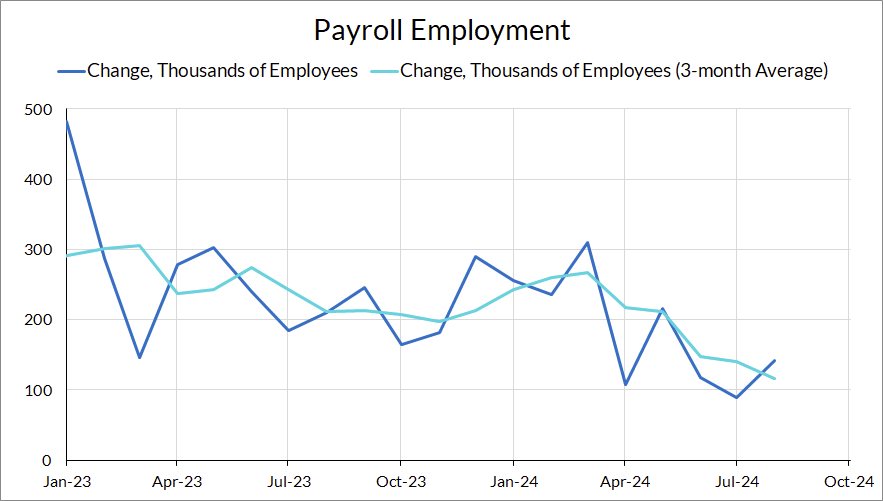
Payroll growth came in slightly under expectations this month, but still at a historically respectable level. However, this print also came with substantial downwards revisions to June and July. For the first time, the 3-month payroll growth rate is below its 2019 average. Moreover, as some FOMC members, the “breakeven” rate of job growth needed to keep up with labor force and immigration growth is likely higher. A recent San Francisco Fed Economic Letter has argued that the short-run breakeven job growth rate is between 130,000 and 220,000; the average growth rate over the last 3 months of 135,000 is barely within that range.
Source: Bureau of Labor Statistics
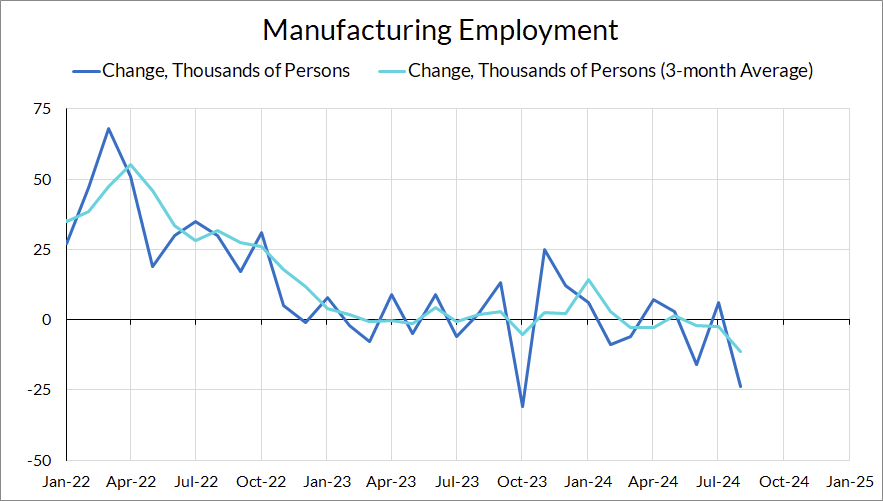
Job growth was particularly weak in two areas in August: Manufacturing and Professional & Business Services. Employment in these sectors, which looked approximately stagnant over the past year, now look like they may be entering into outright job loss territory.
Source: Bureau of Labor StatisticsSource: Bureau of Labor Statistics
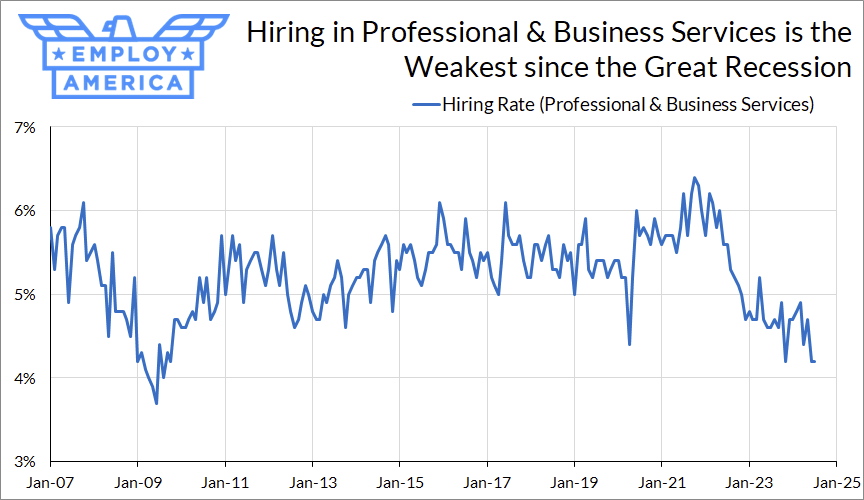
Hiring in the Professional & Business Services took a hit in 2022 and only continued to deteriorate. Hiring in this sector hasn’t been this weak since the Great Recession.
Source: Bureau of Labor Statistics
Job Openings Decline
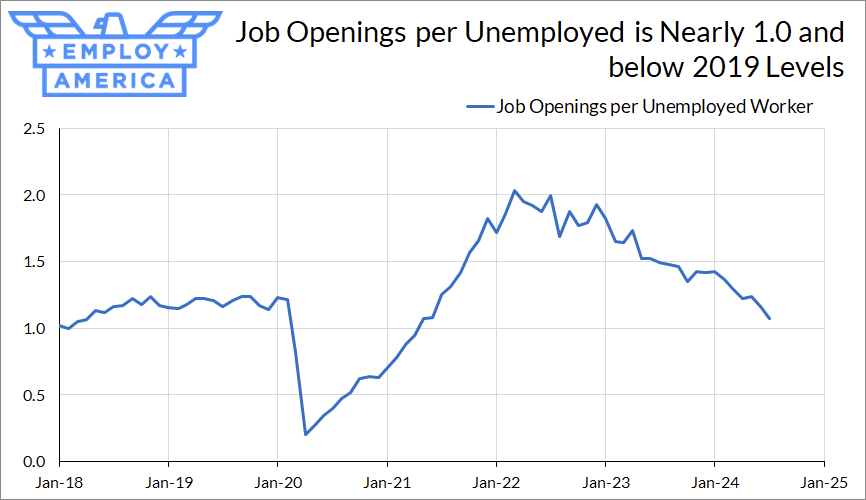
Long-time readers of Employ America will know we are not a fan of job openings as a metric for labor market tightness, but the Fed and many economists believe it to be an important measure. The big news out of the JOLTS data this month was a large decline in the job opening rate. The often-cited vacancy-to-unemployment ratio is now 1.07, just under 2019 levels. This is also just above the level of 1.0 that some have argued is the optimal balance point of the labor market.
Source: Bureau of Labor Statistics, Author’s Calculations. Calculated by dividing nonfarm job openings (JOLTS) by the number of unemployed (CPS).
In fact, if one takes this measure seriously, it likely slightly overestimates labor market tightness during the post-2020 period. This is because ratios of job openings to unemployed are drawn from two separate sources: job openings use JOLTS and the number of unemployed is drawn from the Current Population Survey. The former is benchmarked to the Current Employment Statistics, and overall employment in the CES has been reading a few percentage points higher than the CPS. It’s likely that the number of job openings is either slightly overestimated or the number of unemployed is slightly understated, so the “real” job-openings-to-unemployed ratio is likely a few percentage points lower.
Regardless of how seriously you take the job openings number, the JOLTS data continued to confirm the overall softening trend we’ve seen. Although hires and quits ticked up in the July data, the overall trend is clear: quits are at about 2016 levels and hiring rates are 2014 levels. Finally, regardless of what JOLTS measure you use, the labor market no longer looks overheated.
Source: Bureau of Labor Statistics
The Fed Should Go 50bps in September
In early July, after the release of the June data, I wrote that the unemployment and inflation data up to that point justified a cut in July. The subsequent two months of data have shown the labor market to be continuing the cooling path that we’ve been highlighting for months, and given that the Fed did not cut in July we think it appropriate for the Fed to do 50 bps in September. That argument does not rely on an assessment that the labor market is currently in recession, but rather a recognition that staying on this path is likely to lead to the labor market falling short of full employment.
As of now, the Committee does not seem like they are excited about the idea of going 50 basis points. Some of them have declined to reject the idea of going 50 bps (Williams, speaking right after the data release, declined to give an opinion on 25bps vs 50 bps); others, like Harker and Bostic, have thrown cold water on the idea. Waller said he is open to frontloading cuts—if the labor market deteriorates further than it has. It’s possible Powell can pull the Committee together for a 50 bps cut (with dissents) if he wants it. It may hinge on how much he desires consensus and how willing he is to be forceful with the rest of the Committee.
We think the substantial cooling in the labor market and the large decline in inflation are sufficient to justify a 50 bps cut in September, but the Committee seems driven more by inertia more than anything else. For some inexplicable reason, they seem to think that only a large deterioration in the labor market can justify more than a 25 bps cut.
The link has been copied!
Your link has expired. Please request a new one.
Your link has expired. Please request a new one.
Your link has expired. Please request a new one.
Great! You've successfully signed up.
Great! You've successfully signed up.
Welcome back! You've successfully signed in.
Success! You now have access to additional content.