Even if Sahm Rules Might not be Right This Time, the Fed Should Still Cut
When it comes to the Fed policy today, the question of whether or not these rules are good at telling us if we’re currently in a recession is almost besides the point.

When it comes to the Fed policy today, the question of whether or not these rules are good at telling us if we’re currently in a recession is almost besides the point.
The rise in the unemployment rate to 4.3% in July was enough to trigger the Sahm rule. This event set off a flurry of articles asking whether this means the economy is in a recession or if this time is different. To be clear, we don’t think this means we’re currently in a recession, and neither does Claudia Sahm herself.
Nevertheless, the recent interest in the Sahm rule has also inspired a number of variants. Earlier this year, Parker Ross constructed a Sahm-like indicator using state-level unemployment rates (which we thought was not as alarming as it seemed). More recently, Pascal Michaillat and Emmanuel Saez have released a new paper in which they construct a Sahm-like rule using changes in the unemployment rate and vacancy rates. Their indicator (henceforth the “MS indicator”) is constructed by calculating a similar measure using the vacancy rate, and taking the minimum of the Sahm indicator and the vacancy indicator. Essentially, their indicator flashes red when unemployment is rising and vacancies are falling. The MS indicator has also breached levels not seen outside recessions, and they claim it shows that there’s a 40% chance that the economy is already in a recession.
The impulse to search for a timely recession indicator is understandable. From a policy perspective, it would be useful. After all, the original Sahm rule was proposed as a way to implement automatic fiscal stabilizers. However, the current fixation on these rules may not be helpful for a FOMC deciding when and how fast to cut. Trying to design a rule that performs well across decades of an evolving economy is inherently difficult and potentially discards useful information. Relying on a rule that claims to signal when an economy is already in recession is almost besides the point if the goal is to avoid the recession in the first place.
Since World War II, there have “only” been 11 recessions. This is far too many from a welfare standpoint, but not enough to create a credible statistical rule. Throughout this time, there’ve been large changes to the structure of the economy, including large shifts in industry composition and the rise of women’s labor force participation. The nature of the shocks that historically have led to recessions have also varied over time, from financial crises to commodity price shocks to a pandemic.
It should be no surprise, then, that no one (or even two) labor market measures will reliably be the first to show red during a downturn. The table below shows when, relative to the first month of each recession, a Sahm-like indicator for the unemployment rate, job openings, and prime-age employment crossed 0.5 pp. A negative number means the indicator passed 0.5pp prior to the recession; e.g. “-3” means three months prior to the first month of the recession; positive numbers means the indicator passed 0.5pp after the first month of the recession. The earliest indicator in each recession is highlighted in light blue.
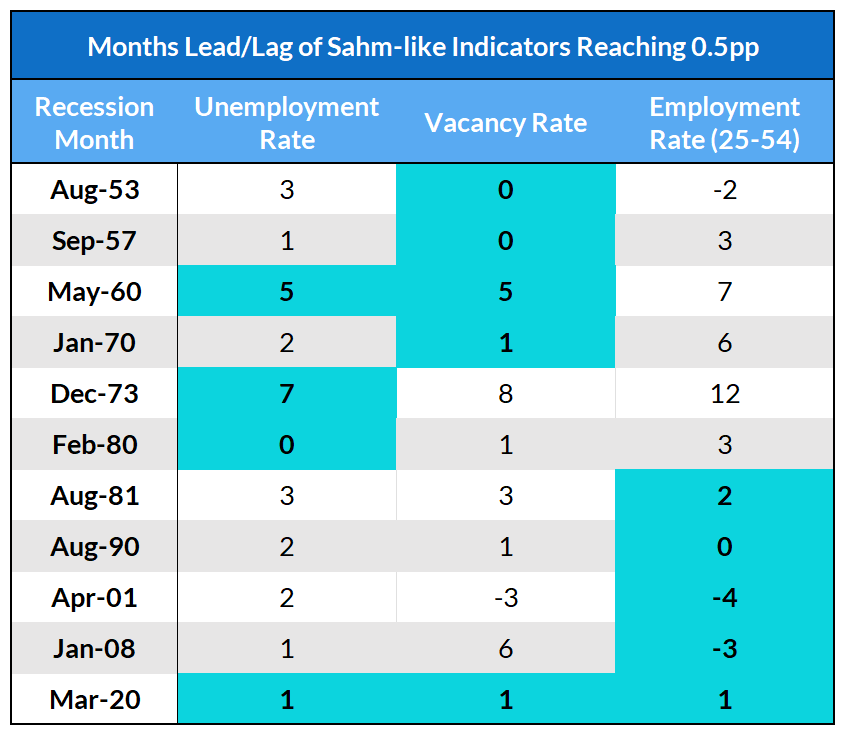
No single labor market indicator performs as the best across the entire period. For example, prime-age employment performs poorly during early recessions but is the most timely indicator in later recessions, even providing prior warning for the 2001 and 2008 recessions. This could be because the secular rise of women’s labor force participation and employment made it harder to see the deterioration in employment rates in earlier recessions. Including prime-age employment would impair the performance of the indicator Michaillat and Saez (2024) due to its poor performance in early recessions—but we shouldn’t ignore it.
We also now have access to data series that are important but have too short of a history to test against more than a handful of recessions. For example, JOLTS data is only available beginning in 2000. While job openings data might plausibly be extended to the pre-JOLTS era using data from postings in newspapers and online, no such comparable series exists for hiring and quit rates.
So far the focus has mostly been on labor market measures, but NBER recession dating is determined by a downturn in broad economic activity, not just the labor market. Retail sales and output showed warning signs long before the labor market did in the recessions in the 1970s. If one were only looking at labor market indicators, the closest analog would be the recessions in the early 1970s. The early months of those recessions were characterized by rising unemployment but flat or even improving employment rates, since participation was also rising. But, those recessions were characterized by poor growth during early quarters, while growth today appears to be strong.
In short, while the parsimony of these rules may be useful in some contexts, paying too much attention to them can detract from other useful information when trying to broadly evaluate the state of the labor market and economy.
The popularity of the Sahm rule has led to an overfixation on the thresholds. It’s as if one side of a 0.5 reading of the Sahm unemployment statistic is safe, and one is not (does it really matter if the rounded number was above 0.5 but the unrounded one was not?).
Michaillat and Saez (2024) calculate the “probability” that the economy is in a recession using the distance of their indicator between 0.3pp (the value at which their indicator historically produces no false positives) and 0.8pp (the value at which there are no false negatives). Implicitly, this means that their indicator is associated with 0% probability of the economy being in a recession when it is 0.3pp or lower.
If we are to take the historical performance of the MS indicator literally, every instance of their indicator reading 0.3pp or higher is associated with a recession in the historical record. That is, the in-sample probability of recession when their indicator reaches 0.3pp is 100%, not 0%. Because their indicator usually breaches 0.3pp after the beginning of a recession, that means that during early parts of the recession, the MS indicator is reading below 0.3pp even though the economy is in a recession, and the probability of being in a recession is positive even when their indicator is less than 0.3pp.
In general, people try to construct these rules such that they deliver no false positives. Inevitably, this means that there is some non-zero recession risk even when these rules are not triggered. If the goal is to respond to a recession, these rules can be useful; not so much if the goal is to preempt or avoid a recession.
Regardless if you use Ross’s state unemployment indicator, the MS indicator, or the original Sahm rule, the core message is still the same: the unemployment rate has risen in a way that historically is associated with recession. That doesn’t mean the Sahm rule (or others building on it) are useless. The Sahm rule captures a very important and consistent pattern in the unemployment rate, which is that the unemployment rate tends not to increase just a little bit. That is a real phenomenon that can be taken seriously without taking the Sahm rule, or any rule, at face value.
Unfortunately, the nature of the problem may simply be that there may not be bulletproof rules that we can construct to tell us with certainty if a recession has started, or is imminent. If there were, we could replace the NBER Business Cycle Dating Committee with a program.
When it comes to the Fed policy today, the question of whether or not these rules are good at telling us if we’re currently in a recession is almost besides the point. While it is true that the Fed should be cutting if we are currently in a recession, that’s a sufficient, not a necessary condition for cutting rates. In the context of the Fed’s current mission of achieving the soft landing, an indicator that produces some false positives is actually preferable to one that does not, since waiting until the recession is too late.
“There is a danger when central banks fall behind events on the ground…. It’s important that we not assume that if the labor market were to deteriorate past normal, that we could react and fix that, once it’s already broken.”
Austan Goolsbee, 8/14/24
The recent rise in the unemployment rate and the slowing in the hiring rate point to a significant shift in the risks to the labor market outlook while the inflation data, including a benign July print, point to less risk on the inflation front. That is the crux of the argument for rate cuts in September, and it does not rely on a declaration that the economy is currently in recession.