Most of the Personal Consumption Expenditures (PCE) inflation gauges are sourced from Consumer Price Index (CPI) data, but Producer Price Index (PPI) input data is of increasing relevance, import price index (IPI) data can prove occasionally relevant. There are also some high-leverage components that only come out on the days of the GDP and PCE releases.
If you'd like to start a 90-day free trial of our exclusive content, you can do so using this link. If you have any questions or would like to see samples of our past content, feel free to get in touch with us.
Summary: PCE Nowcasts
If you were following the PCE implications of the CPI and PPI data closely ahead of the September FOMC meeting, you would have seen this softer Core PCE print coming ahead of time. Judging by what Chris Waller and some other Fed officials said, the softness of the PCE data for August gave some additional justification for pursuing a 50 basis point cut in September itself (Nick Timiraos and Colby Smith's reporting on September being a close call came after the PPI release). Despite long-term revisions to the national accounts in this iteration of the GDP and Personal Income releases, the inflation picture looks remarkably similar to what the Fed would have modeled two weeks ago.
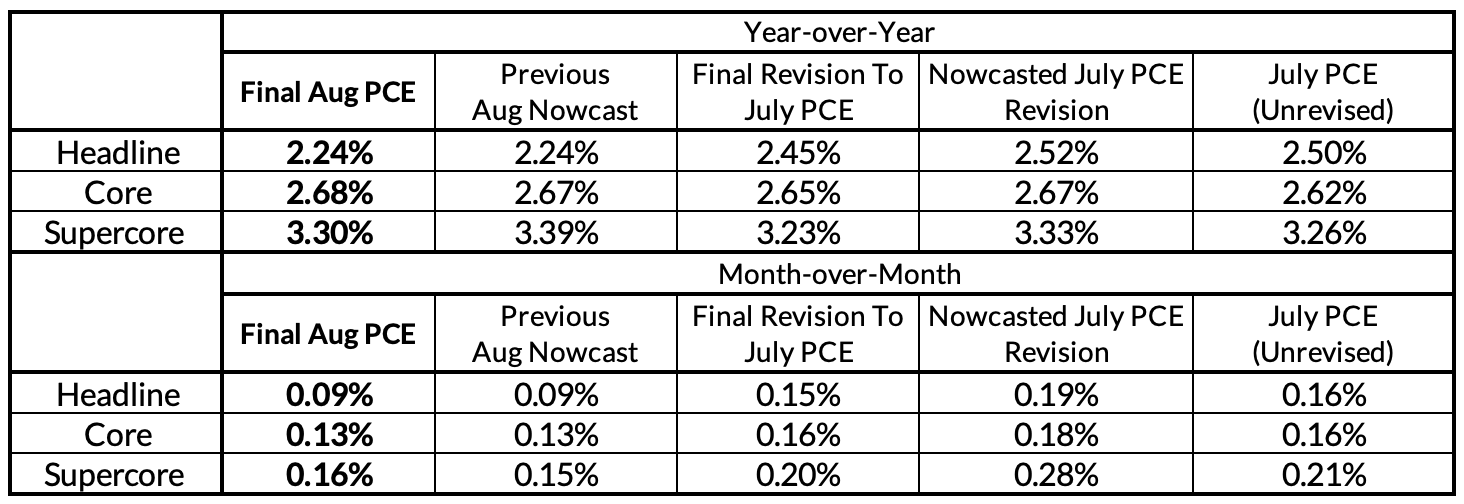
All in all, 0.13% m/m and 2.68% y/y on Core PCE is almost identically in line with what we nowcasted as of yesterday's GDP release and only fractionally different from what we were tracking prior to the September meeting. While there are marginal issues to highlight, we don't see any gamechangers in the data. The Fed will need to see more signs of soft inflation or labor market data to pursue 50 basis points in November as well, but we wouldn't write off that prospect at this stage. We see a 25 basis point cut as the base case with about 60% probability, and a 50 basis point cut as the next likely outcome, with about 40% probability.
Prescriptively, we are in alignment with the Fed's reaction function. While the Fed certainly dragged their feet for much of this year in normalizing interest rates, they are now rightly compensating with a more timely and frontloaded reaction function. The location of the neutral rate might be ambiguous, but when policy rates have been so obviously elevated, the restrictive stance of Fed policy is unambiguous. Front-loading makes sense when important data signals elevated downside risk. The unemployment rate signaled as much headed into the September meeting. Whether it will continue to suggest elevated risk headed into the November meeting is still yet to be determined.
Even though the labor market data is taking on elevated relevance, the inflation data likely still matters. Right now the median FOMC member foresees Core PCE averaging 0.150% to 0.181% per month until the rest of the year. A big wild card here is what happens to both official housing CPI/PCE inflation and market rent measures that Chair Powell mentioned as taking on heightened relevance. We will be watching both very carefully for signs of both progress and potential reacceleration risk.
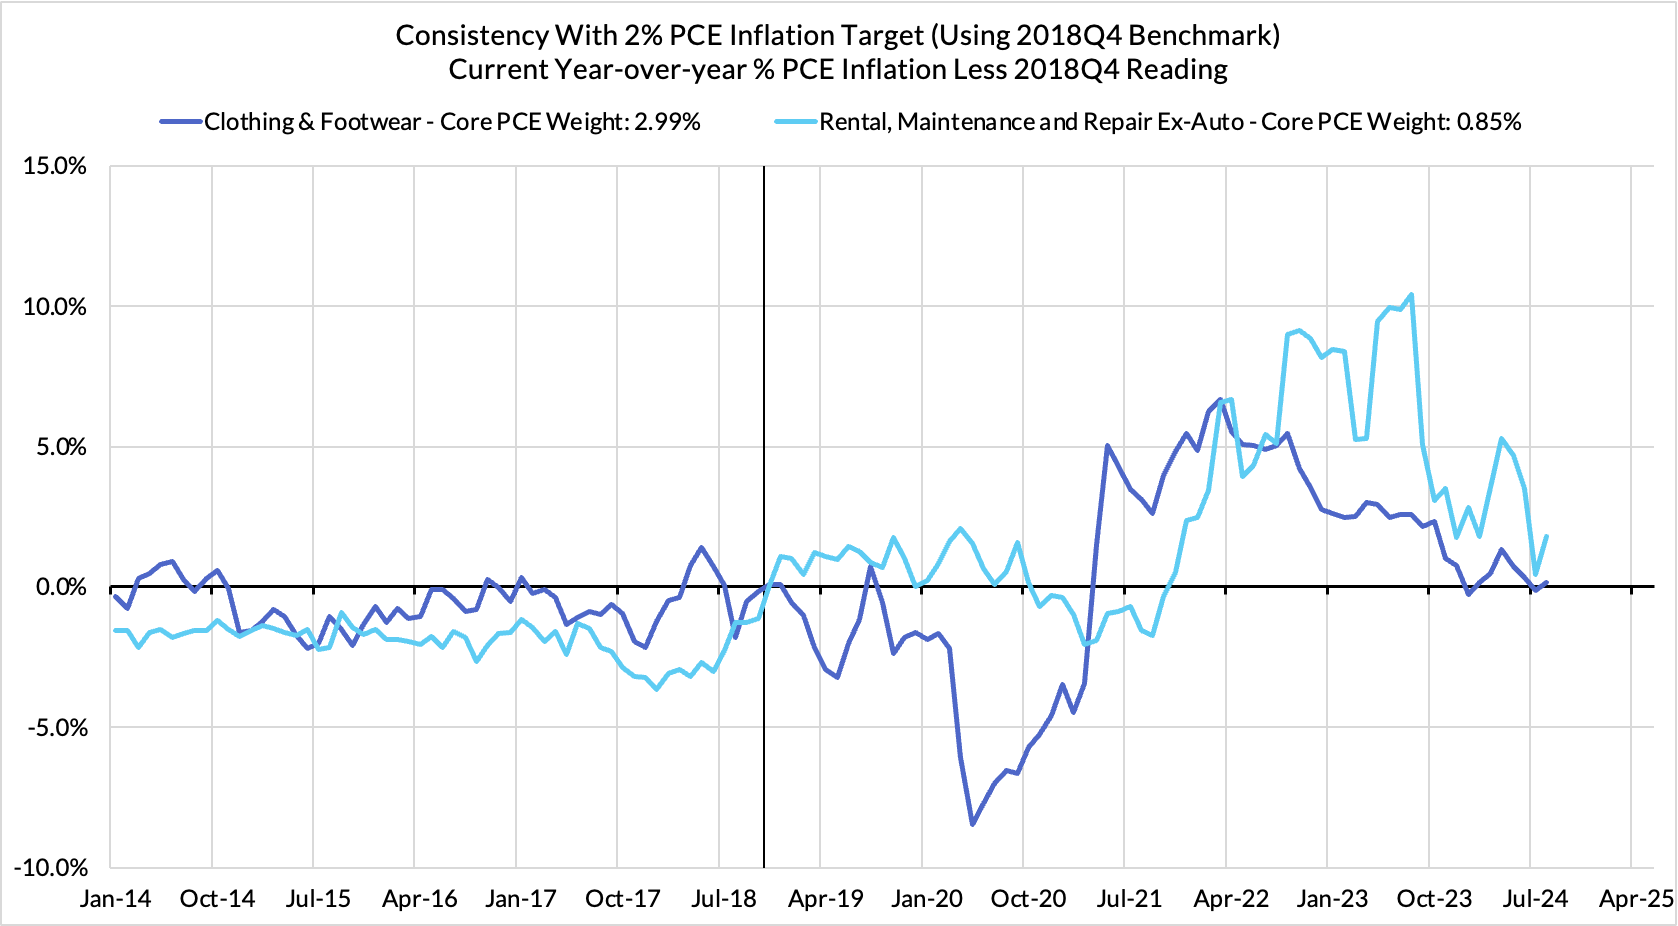
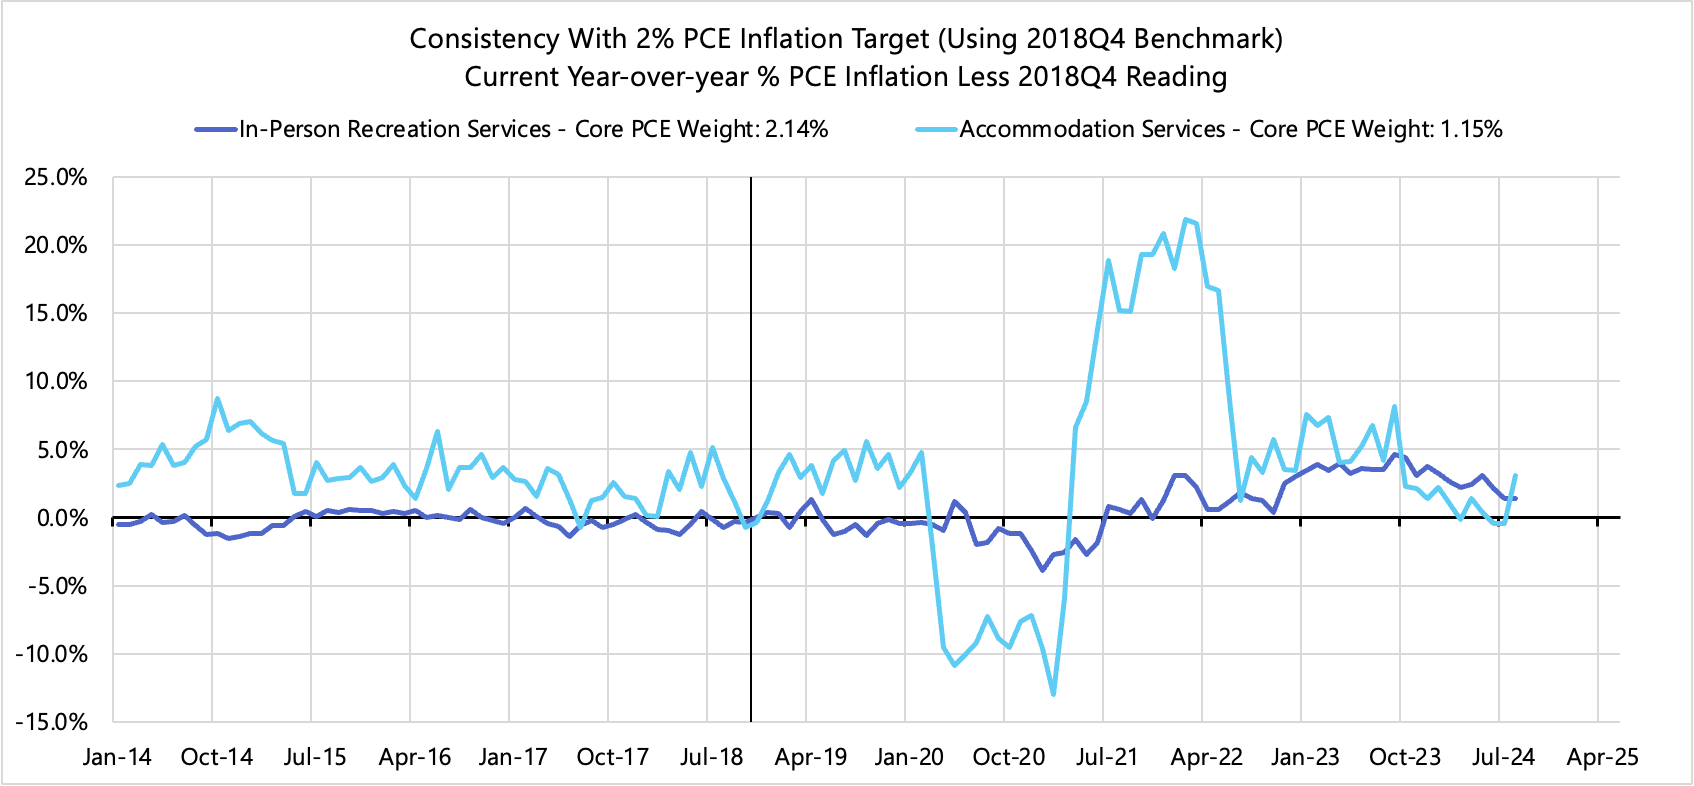
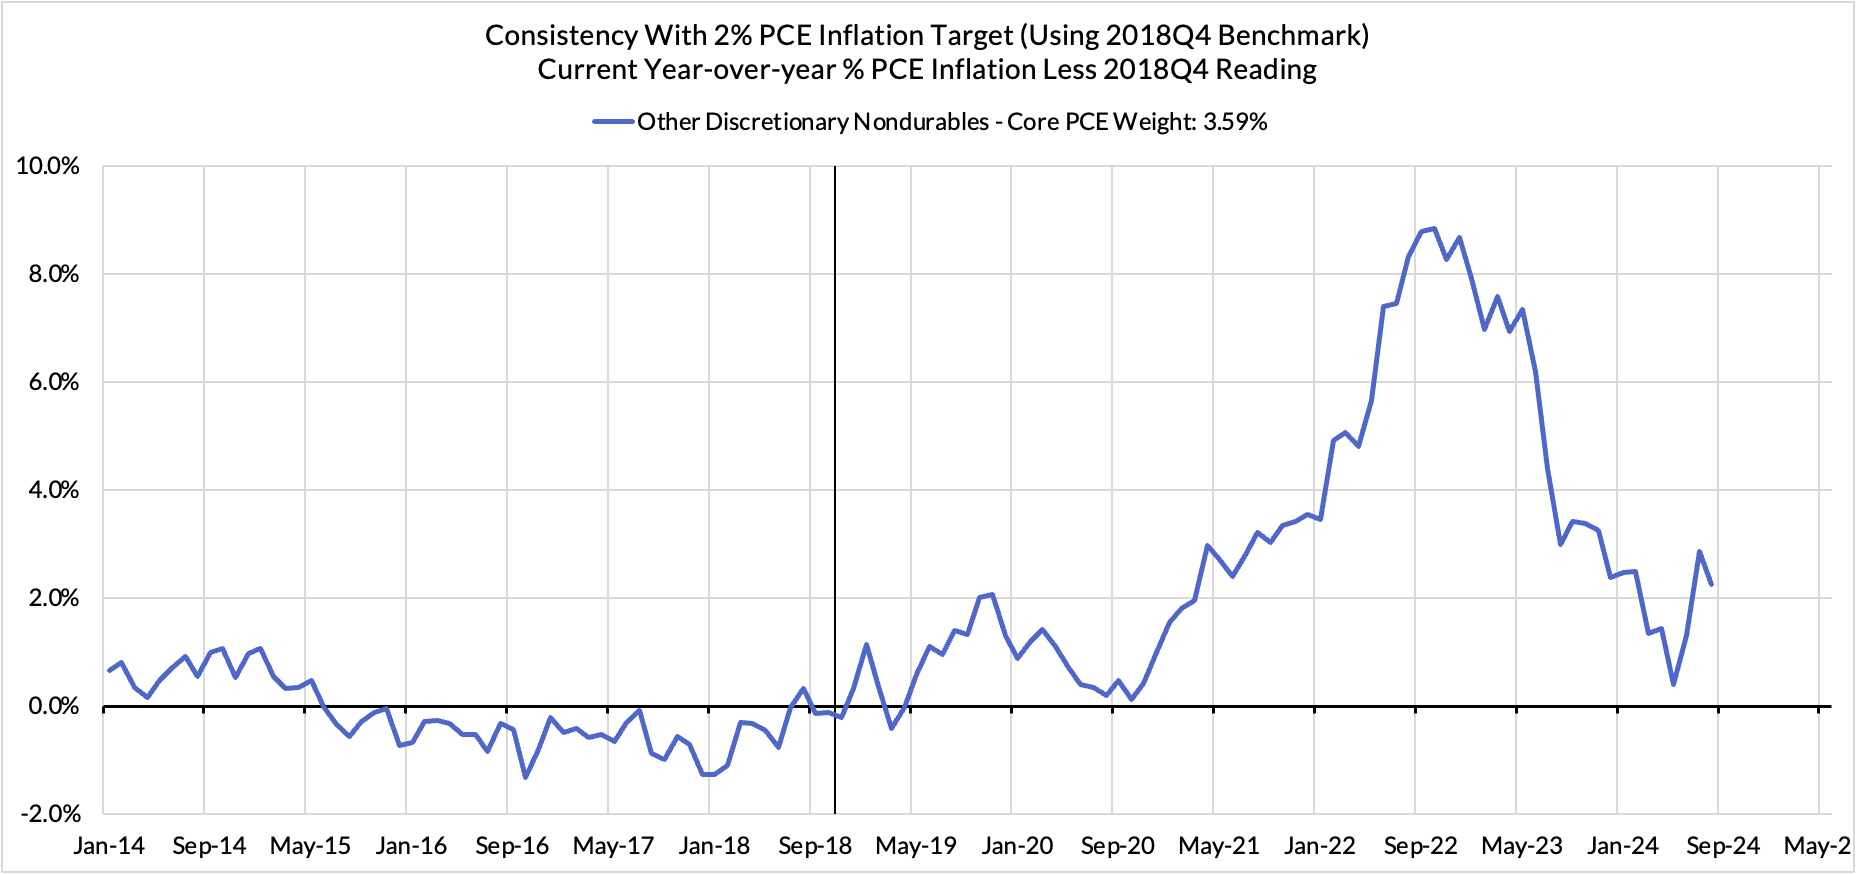
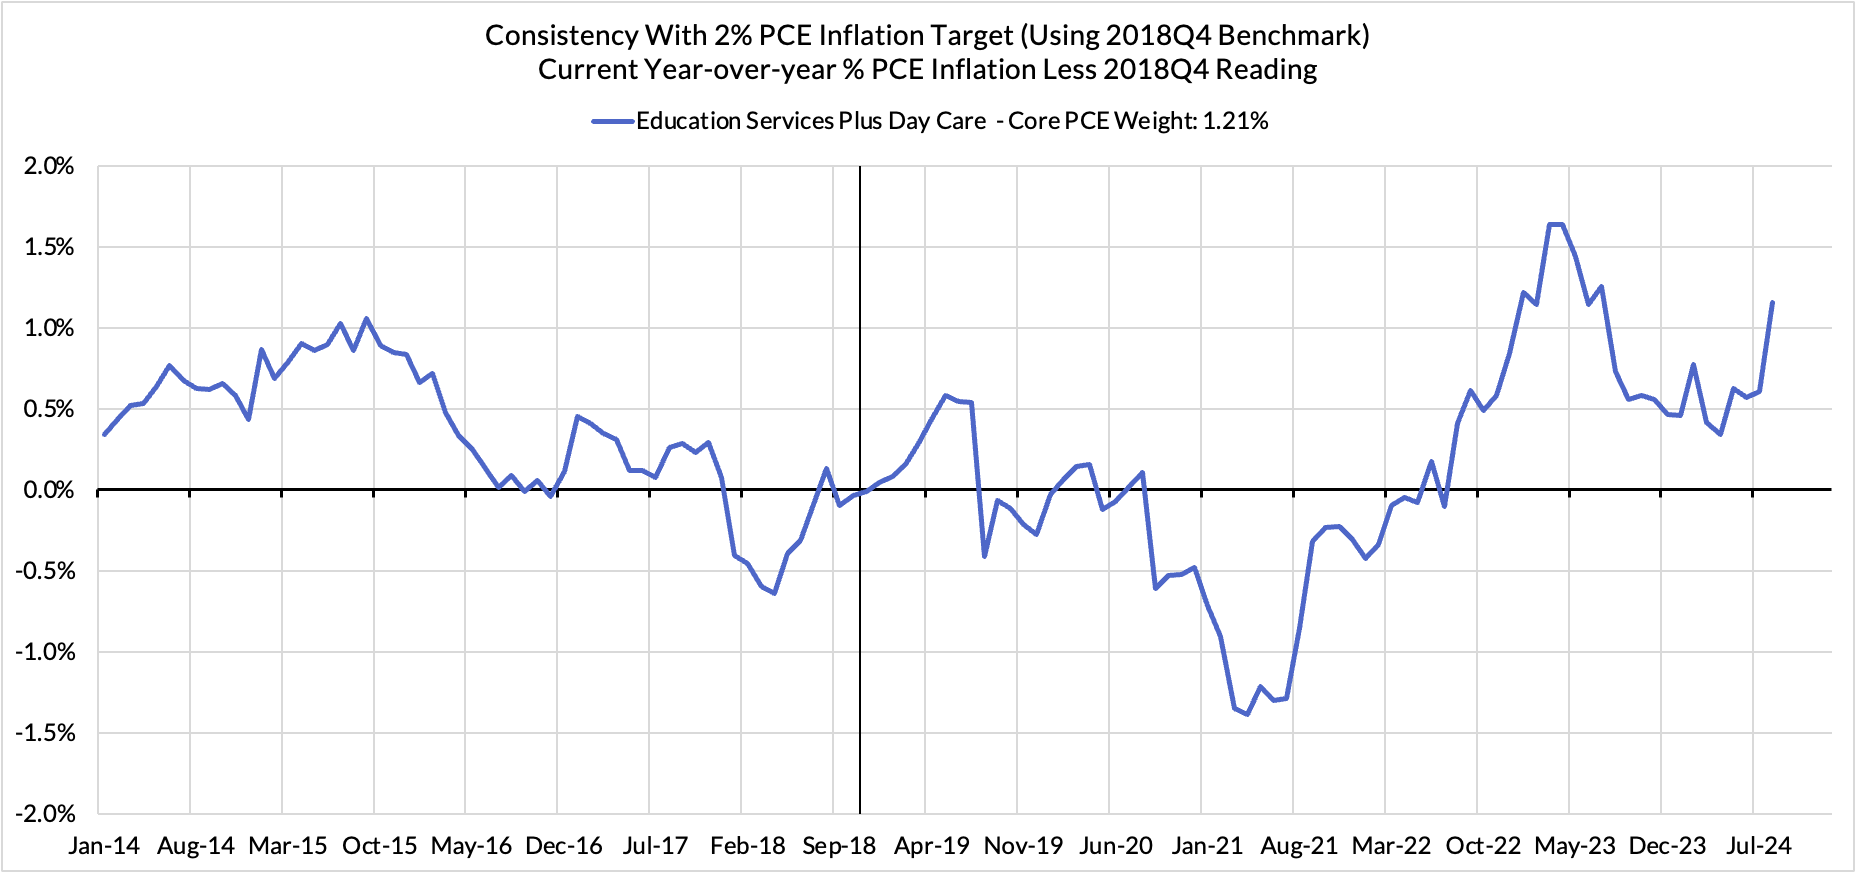
Inflation Overshoots At The Component Level
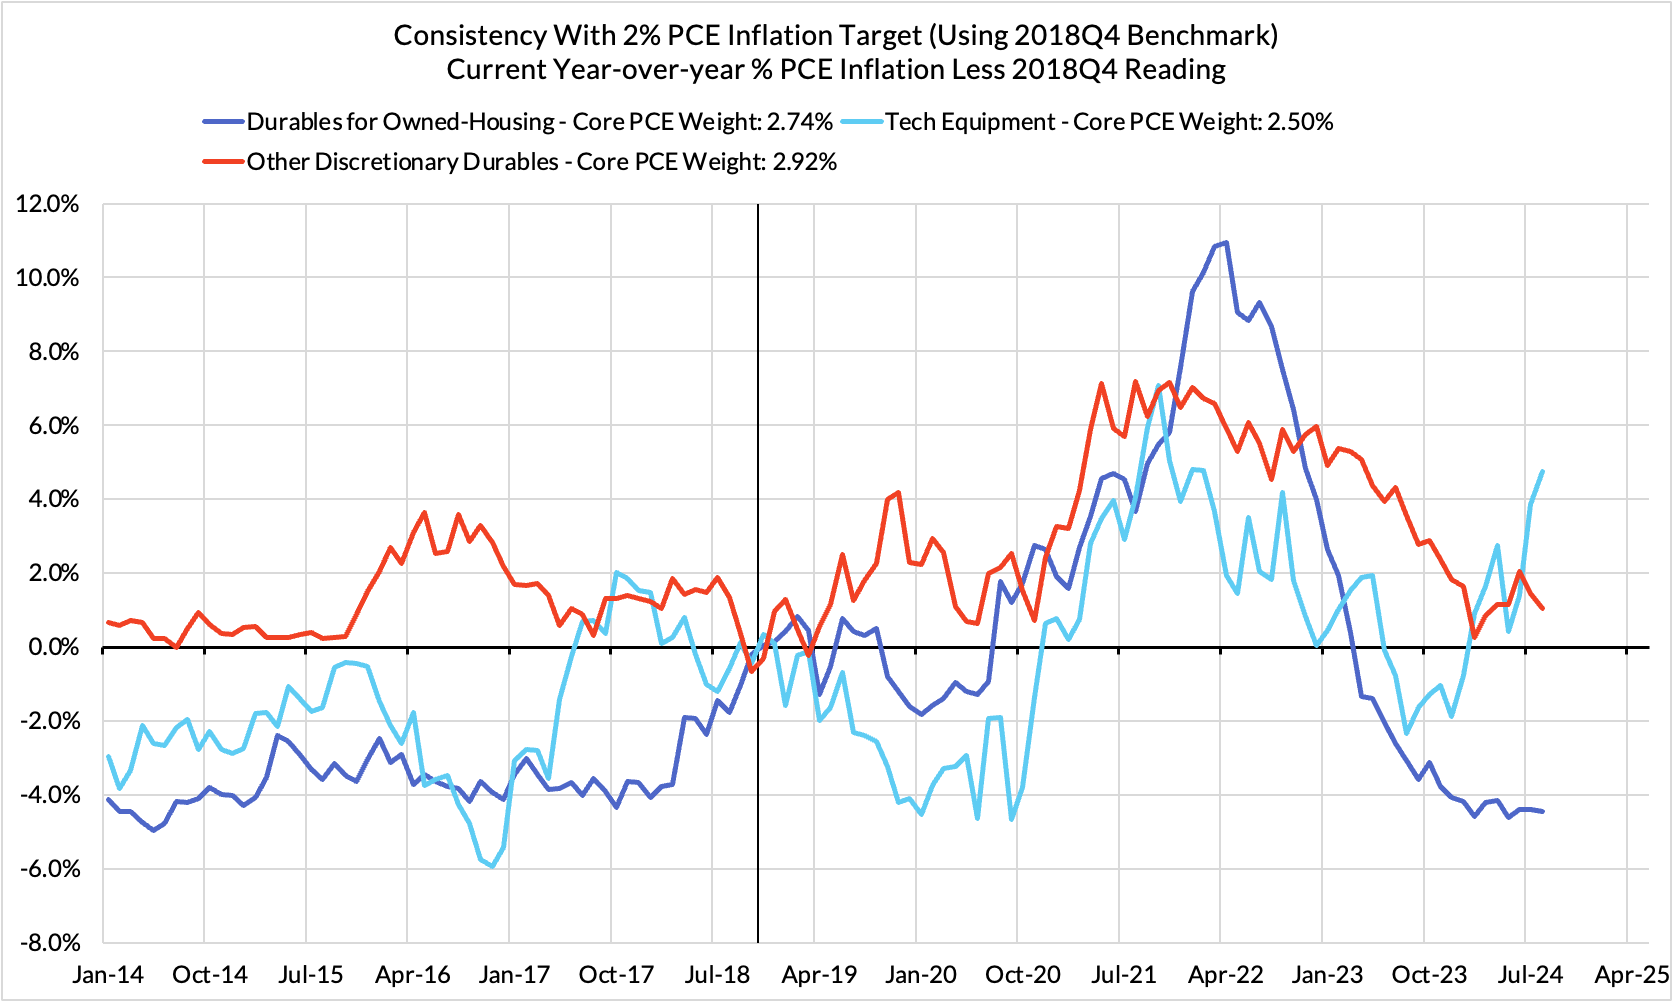
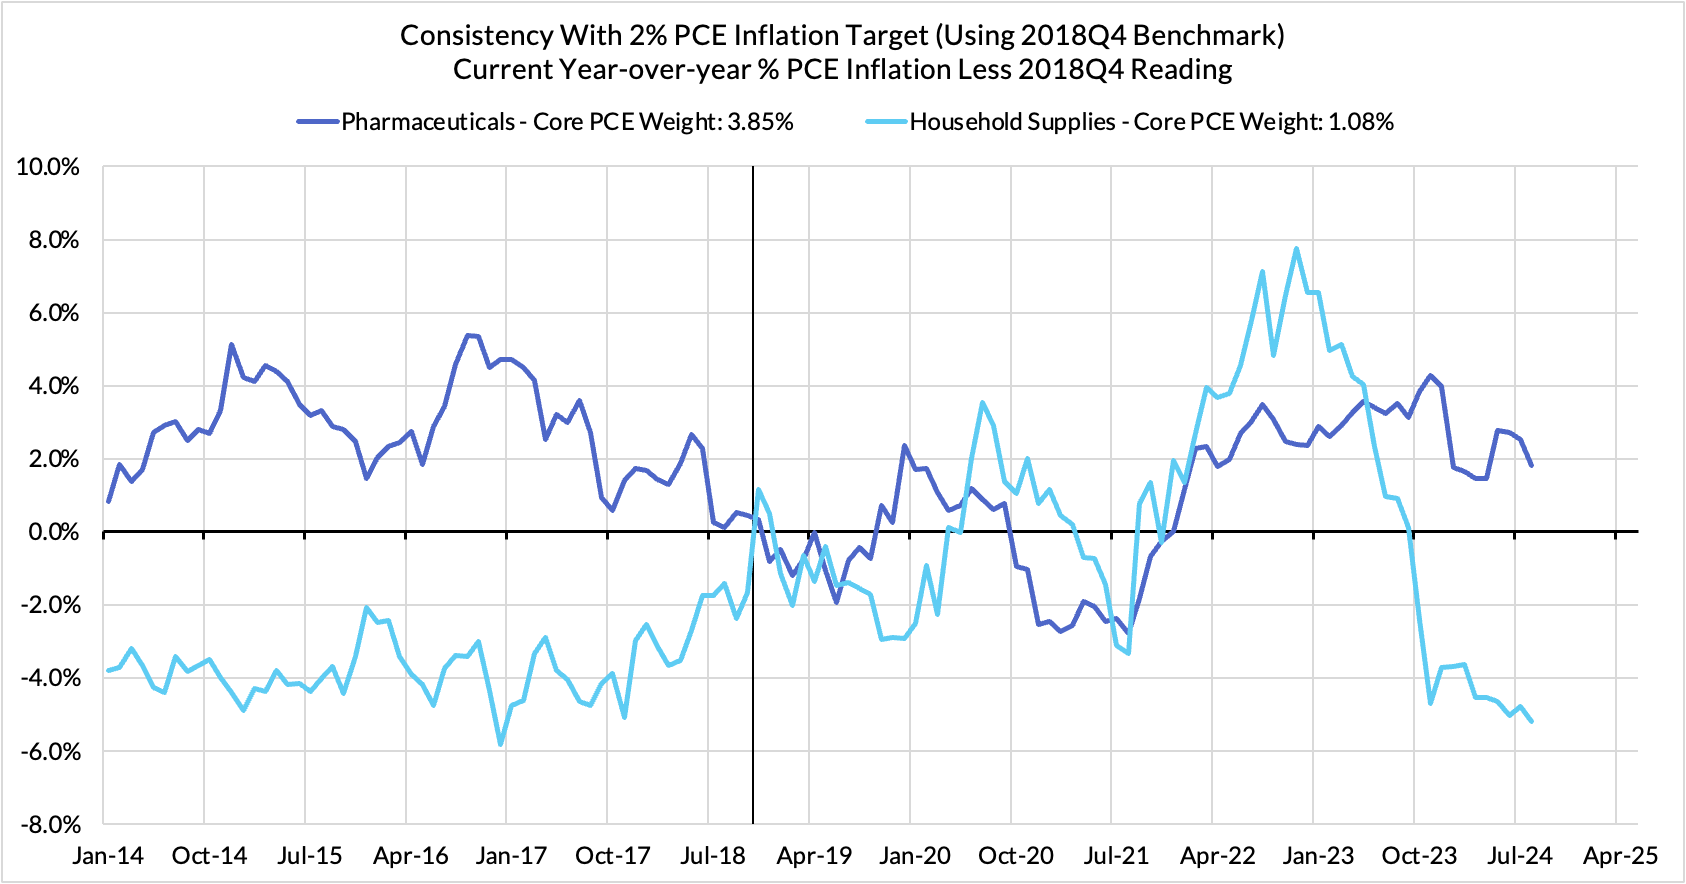
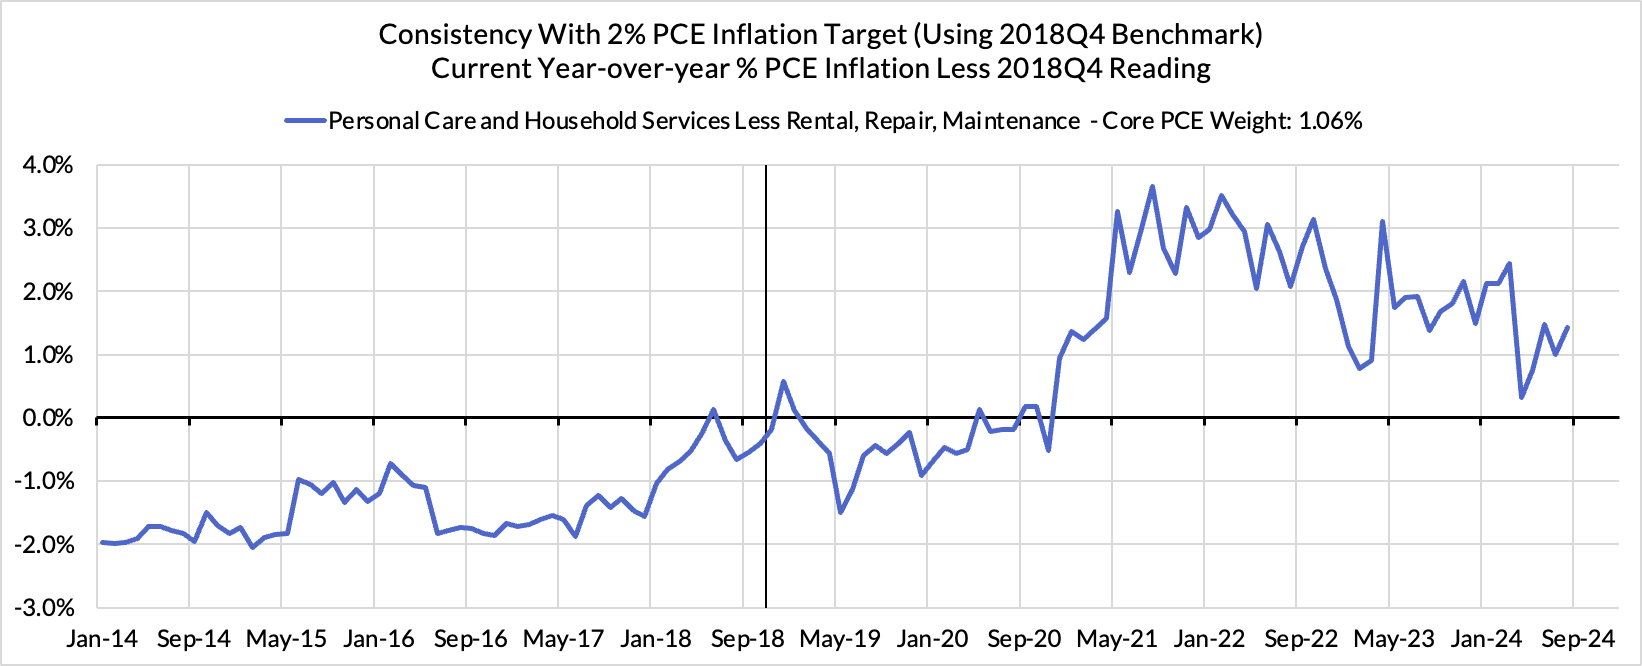
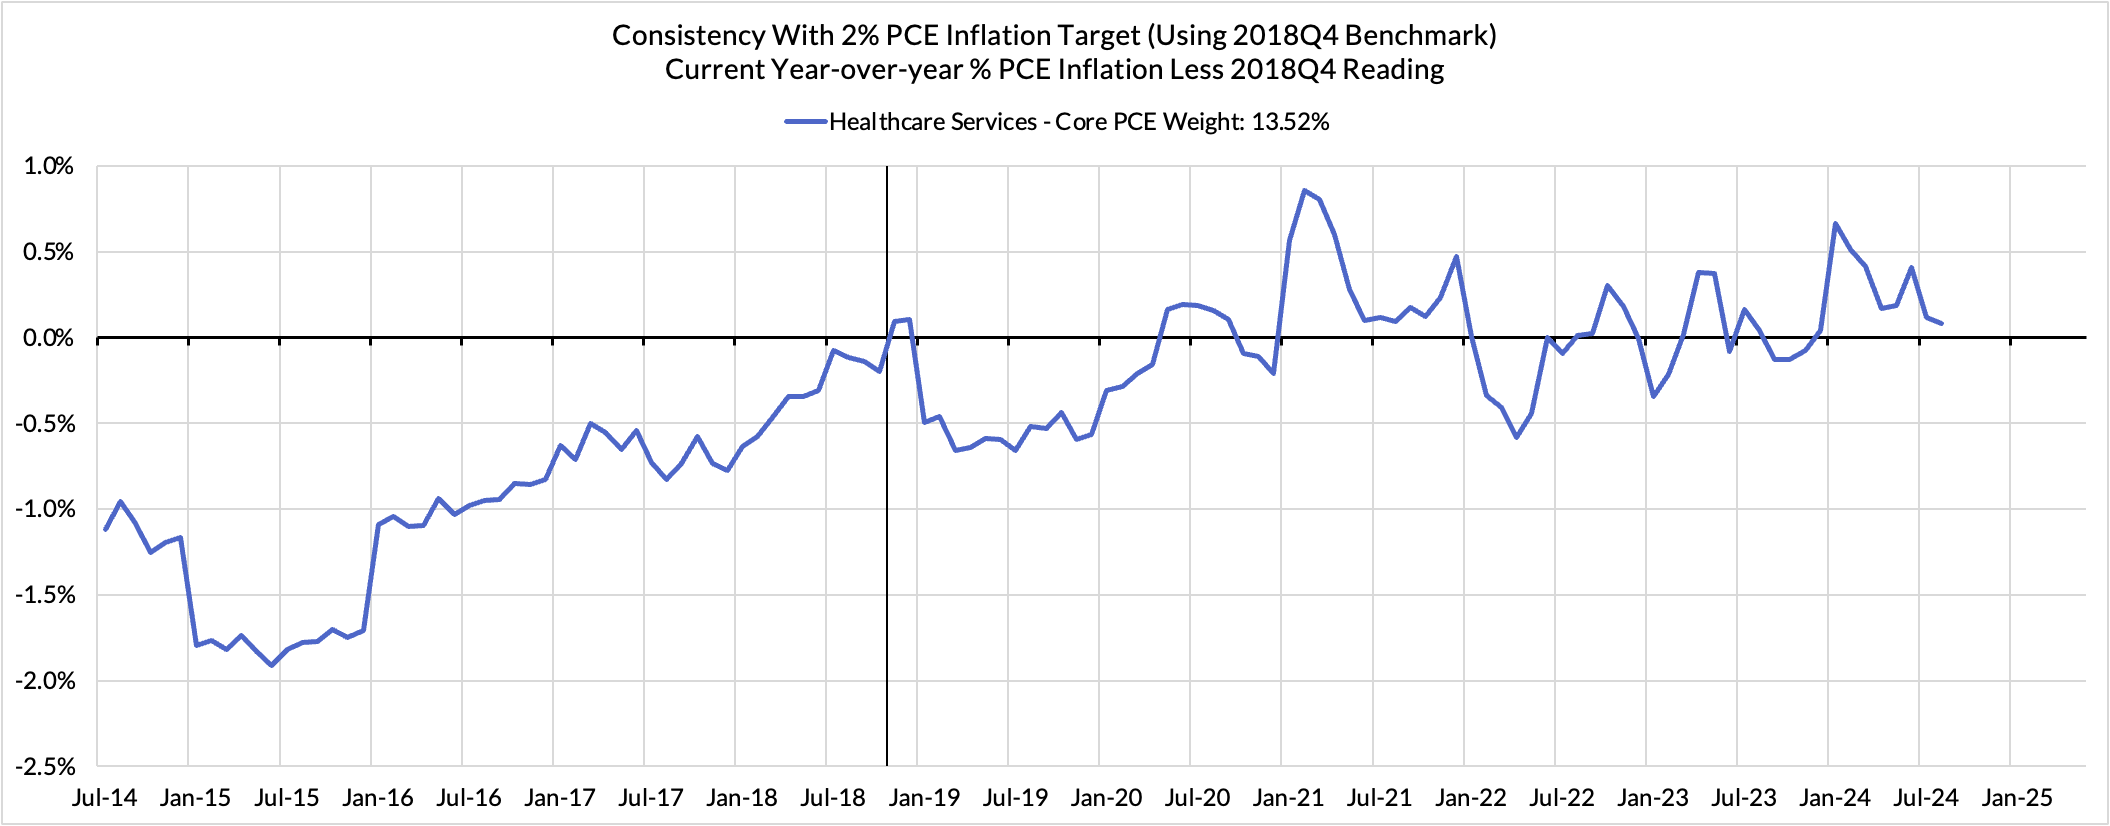
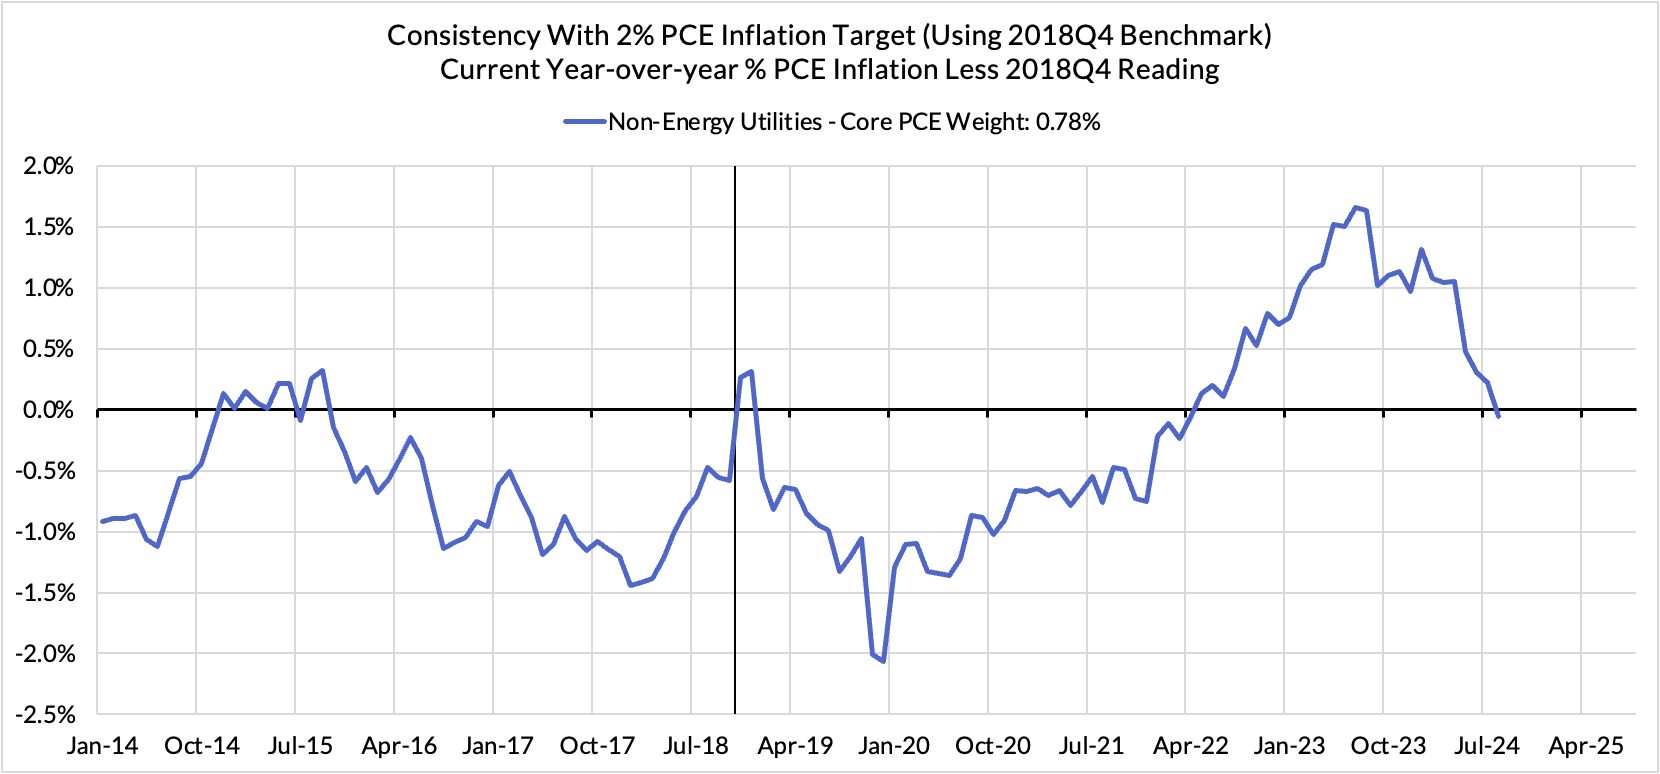
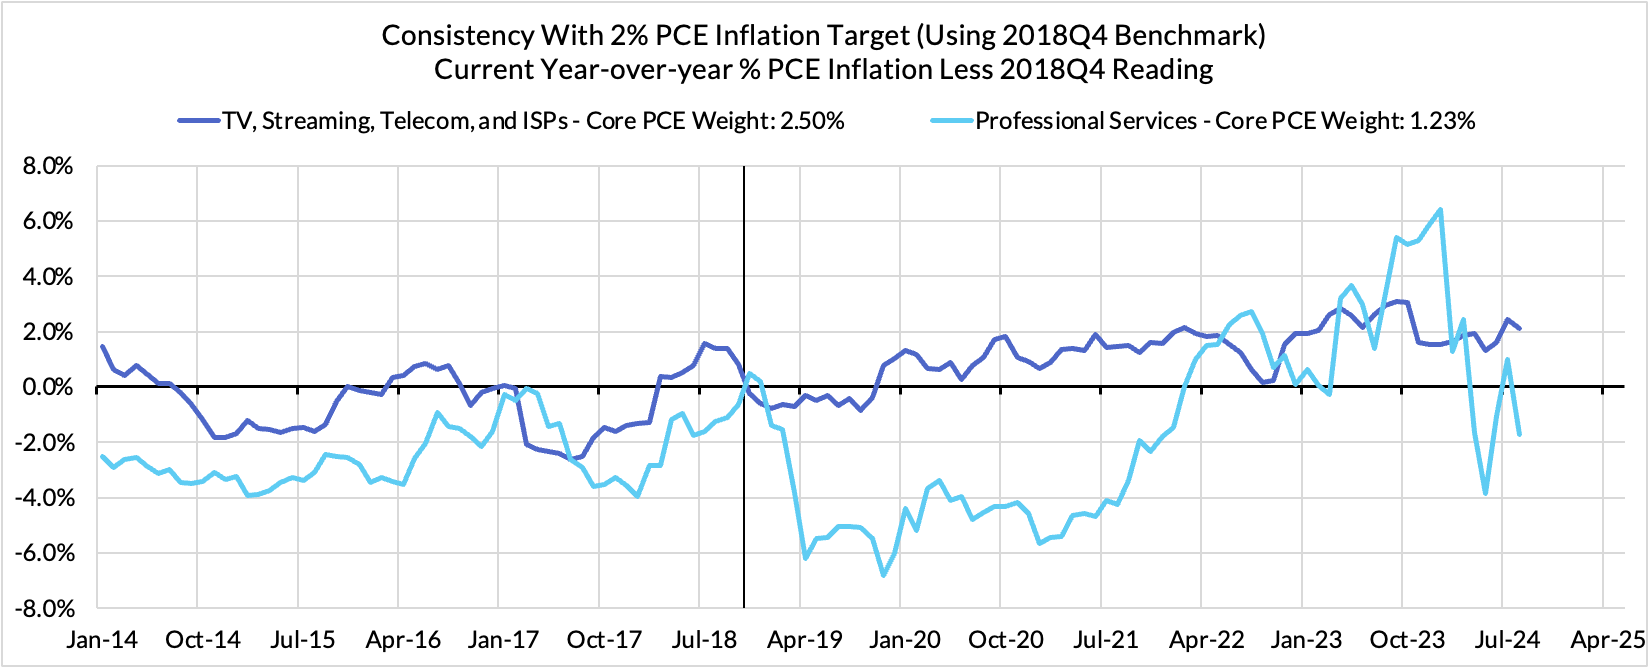
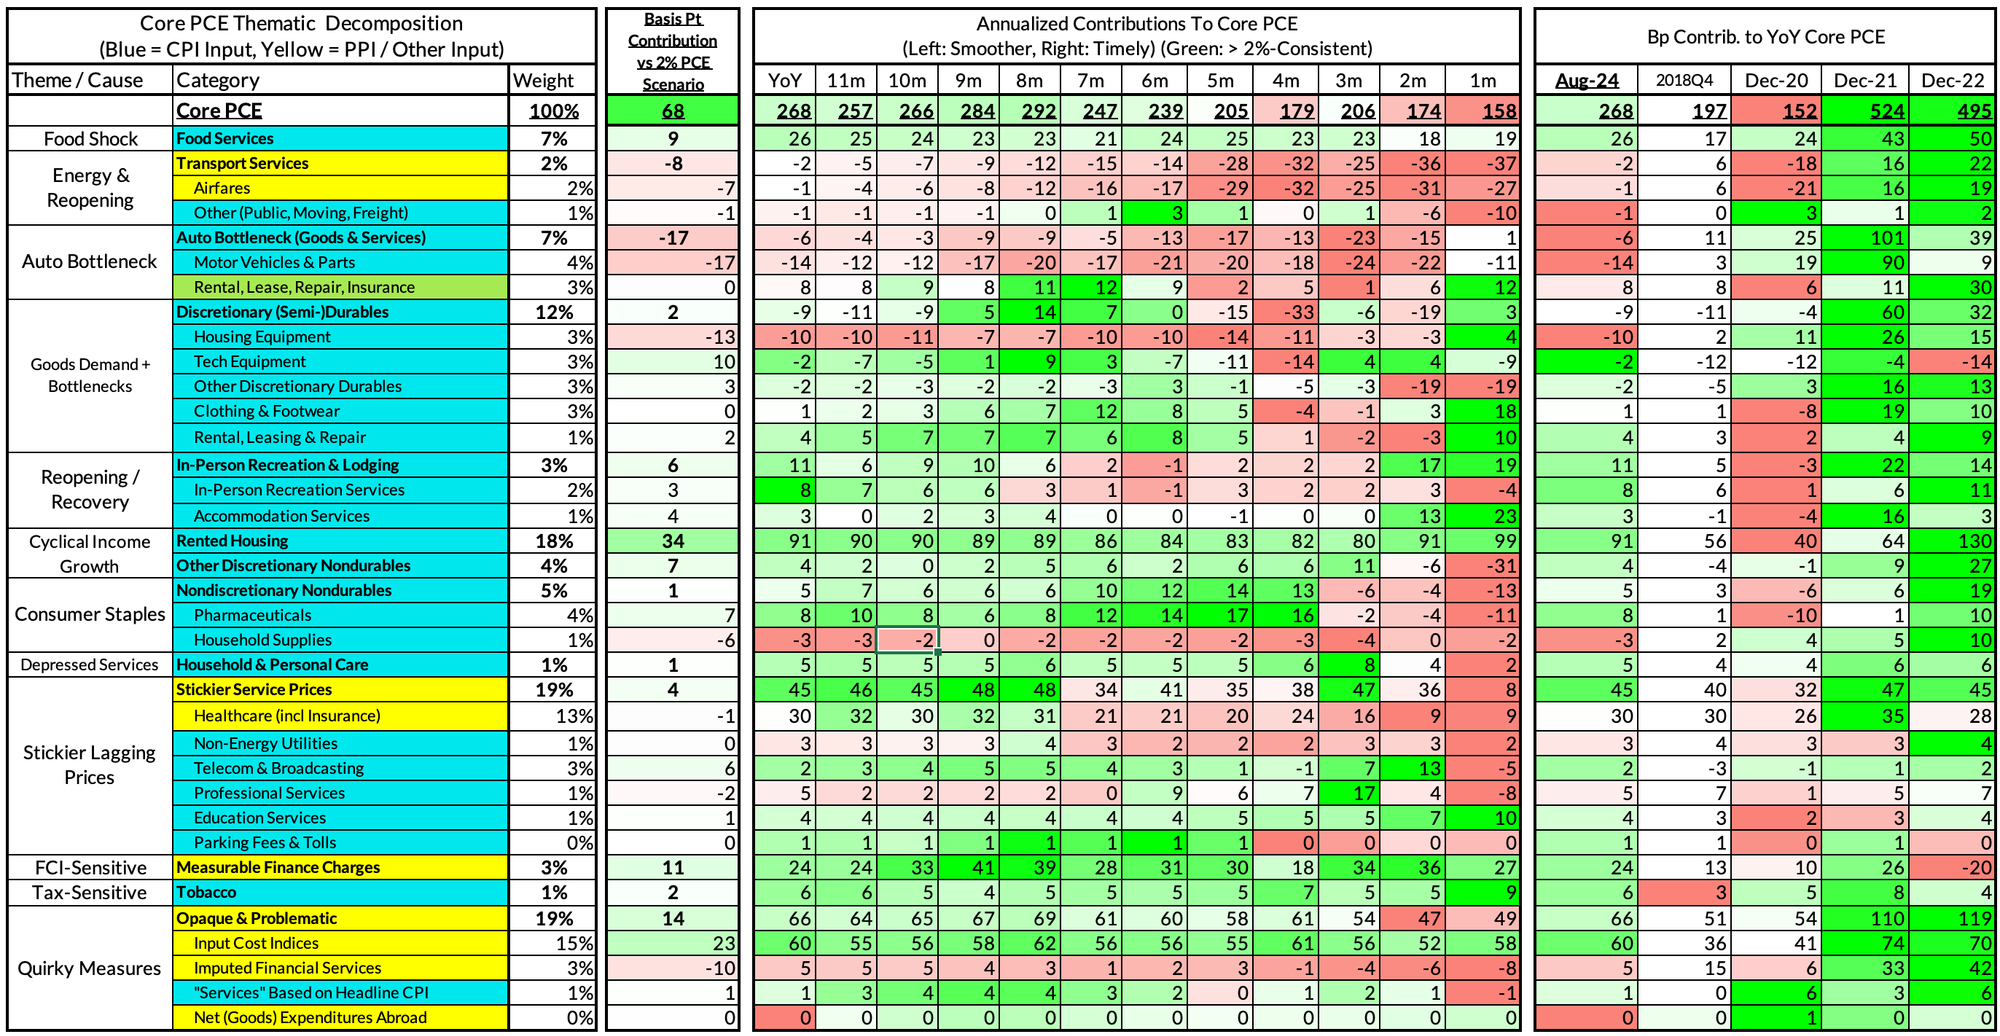
For the Detail-Oriented: Core PCE Heatmaps
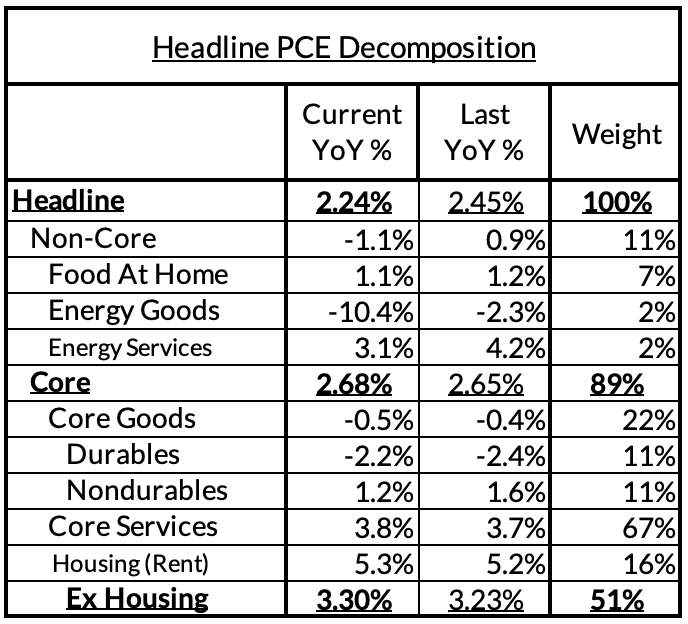
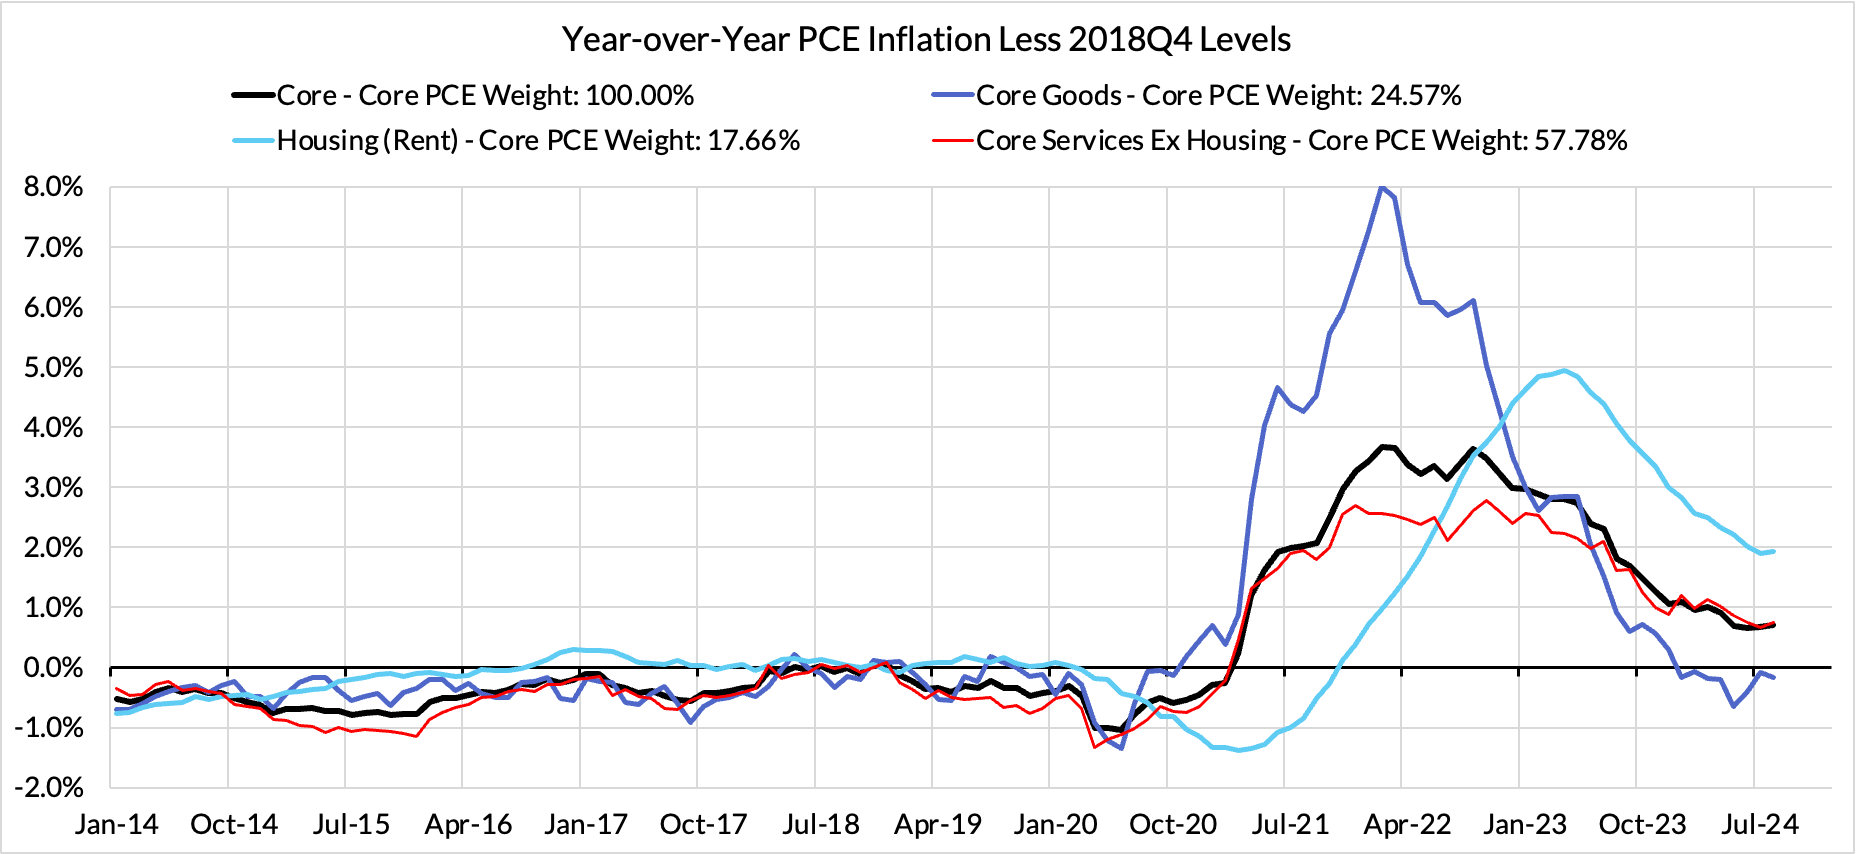
Right now Core PCE (PCE less food products and energy) is running at a 2.68% year-over-year pace as of August, 68 basis points above the Fed's 2% inflation target for PCE. That projected overshoot is disproportionately driven by catch-up rent CPI inflation in response to the surge in household formation (a byproduct of rapidly recovering job growth) and market rents in 2021-22. Rent is on track to contribute 34 basis points to the 68 basis point Core PCE overshoot.
There are other contributors to the overshoot:
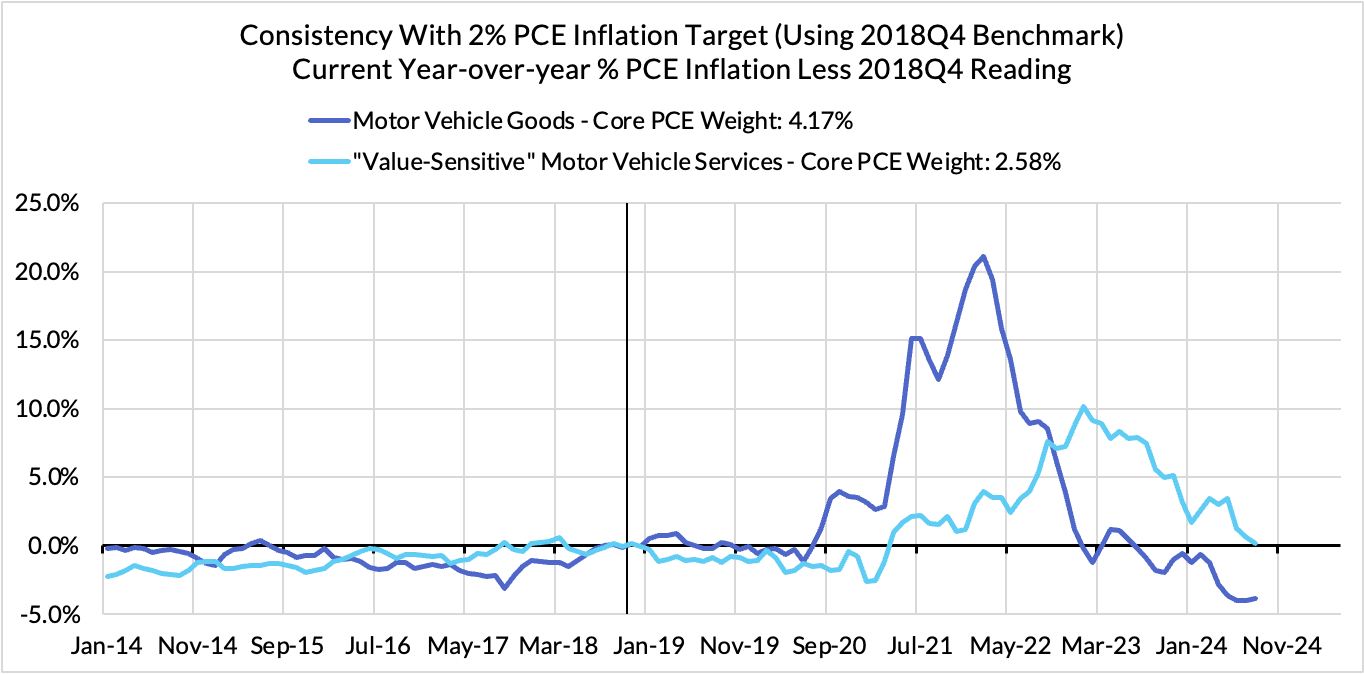
- Some more supply-driven (food inputs likely adding 9 basis points to the overshoot, unwinding motor vehicle bottlenecks now likely subtracting 17 basis points after being a substantial contributor)
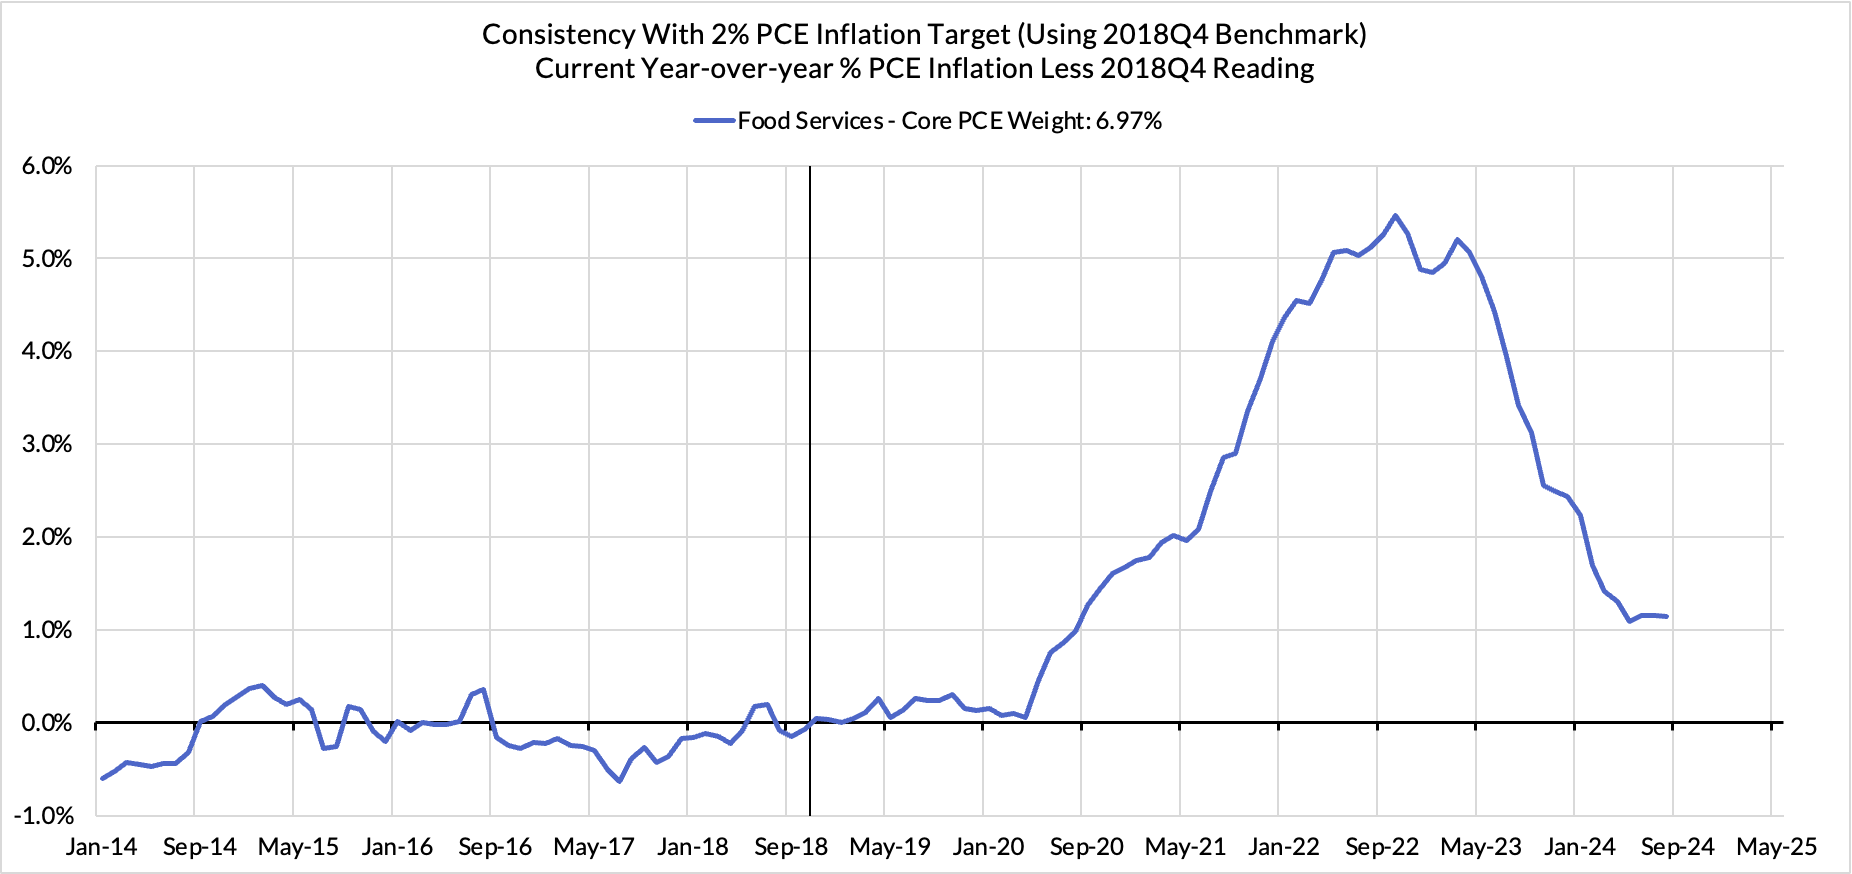
- Some more demand-driven (in-person recreation and lodging services likely adding 6 basis points to the overshoot)
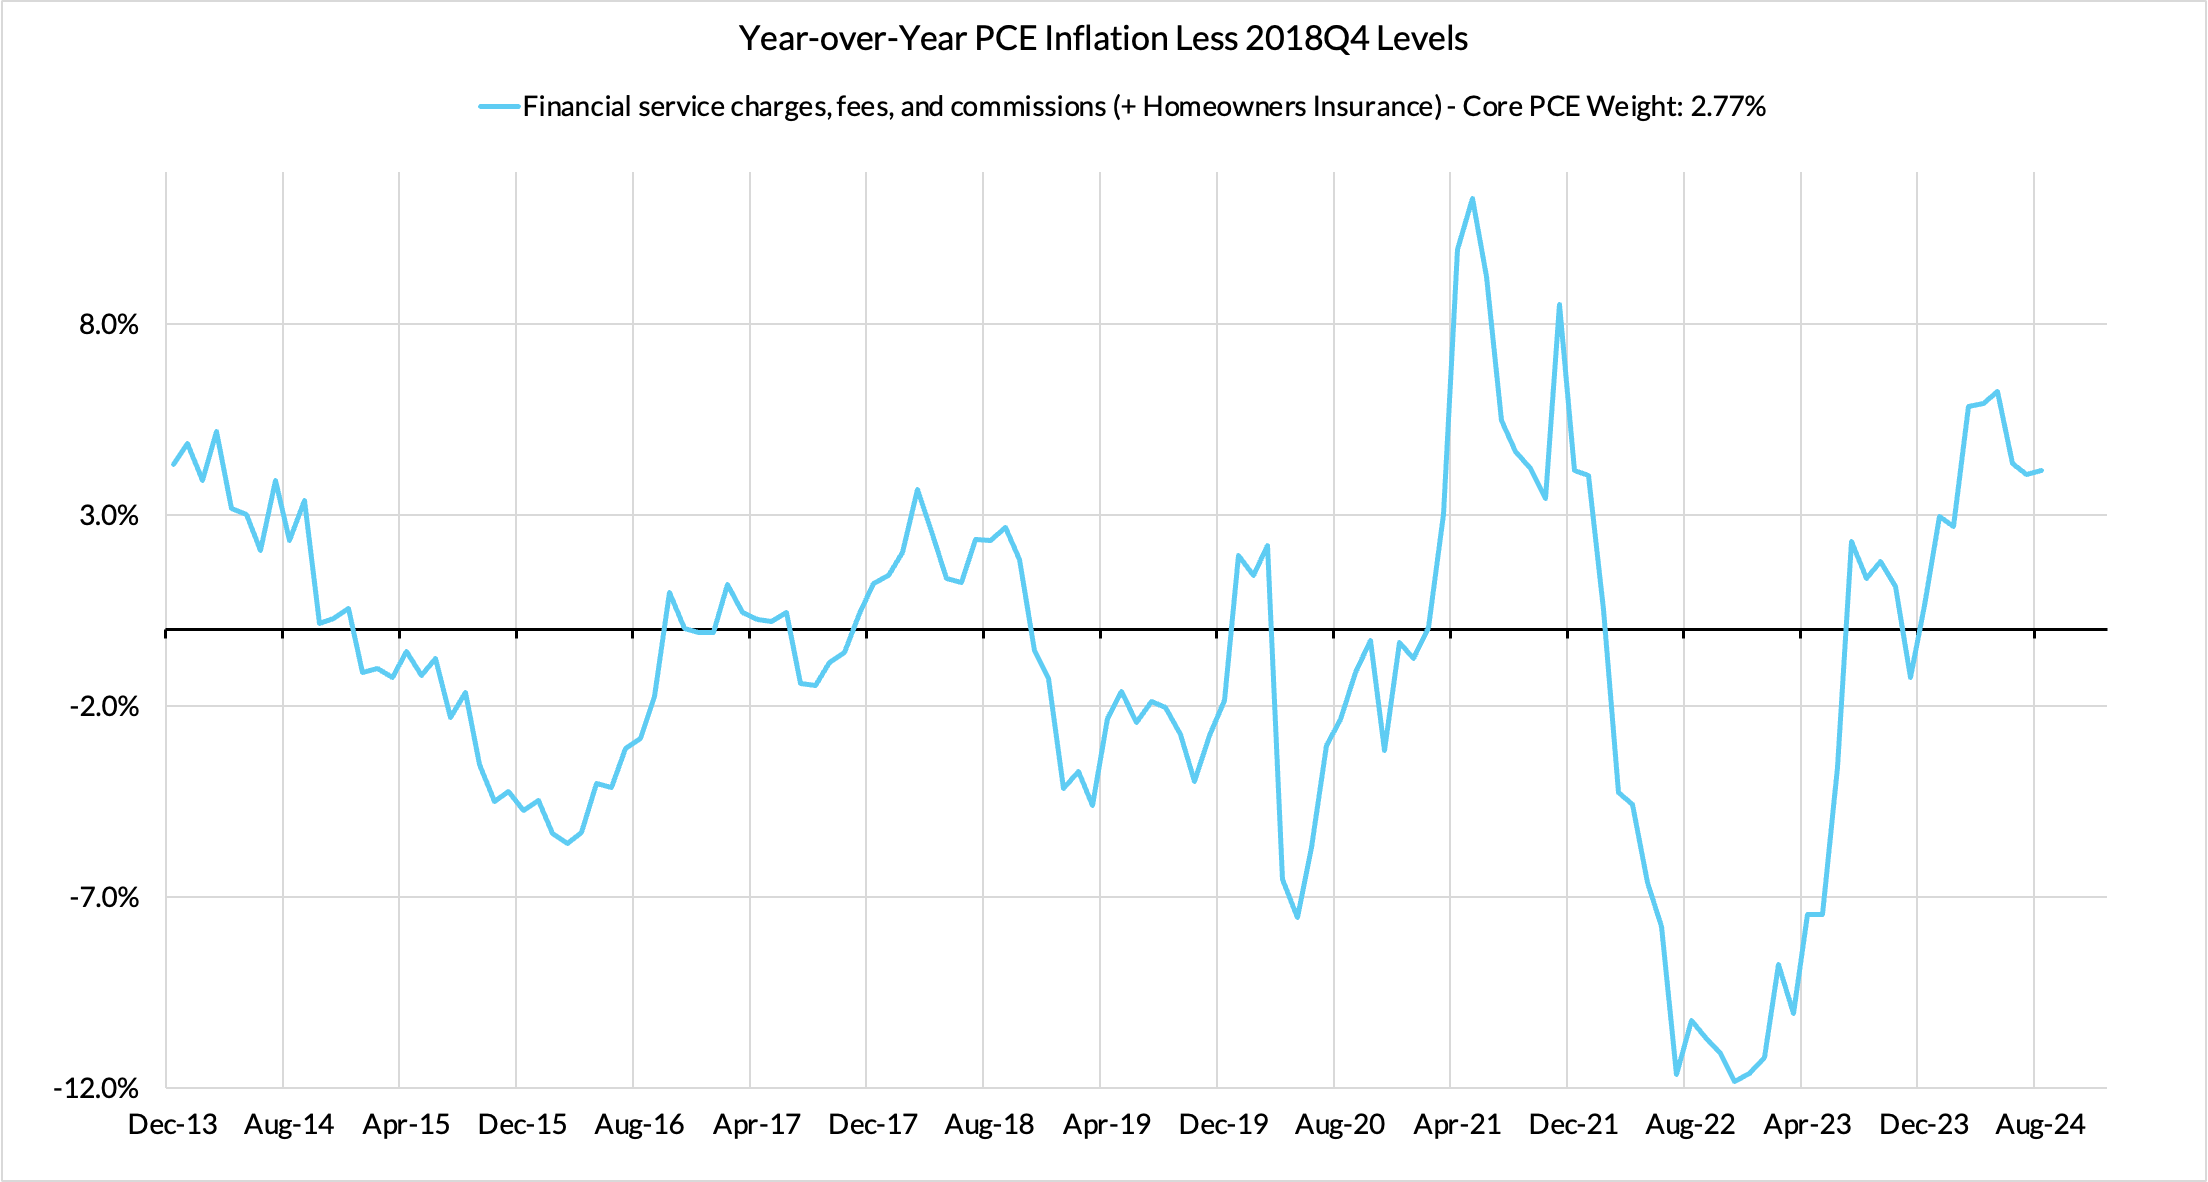
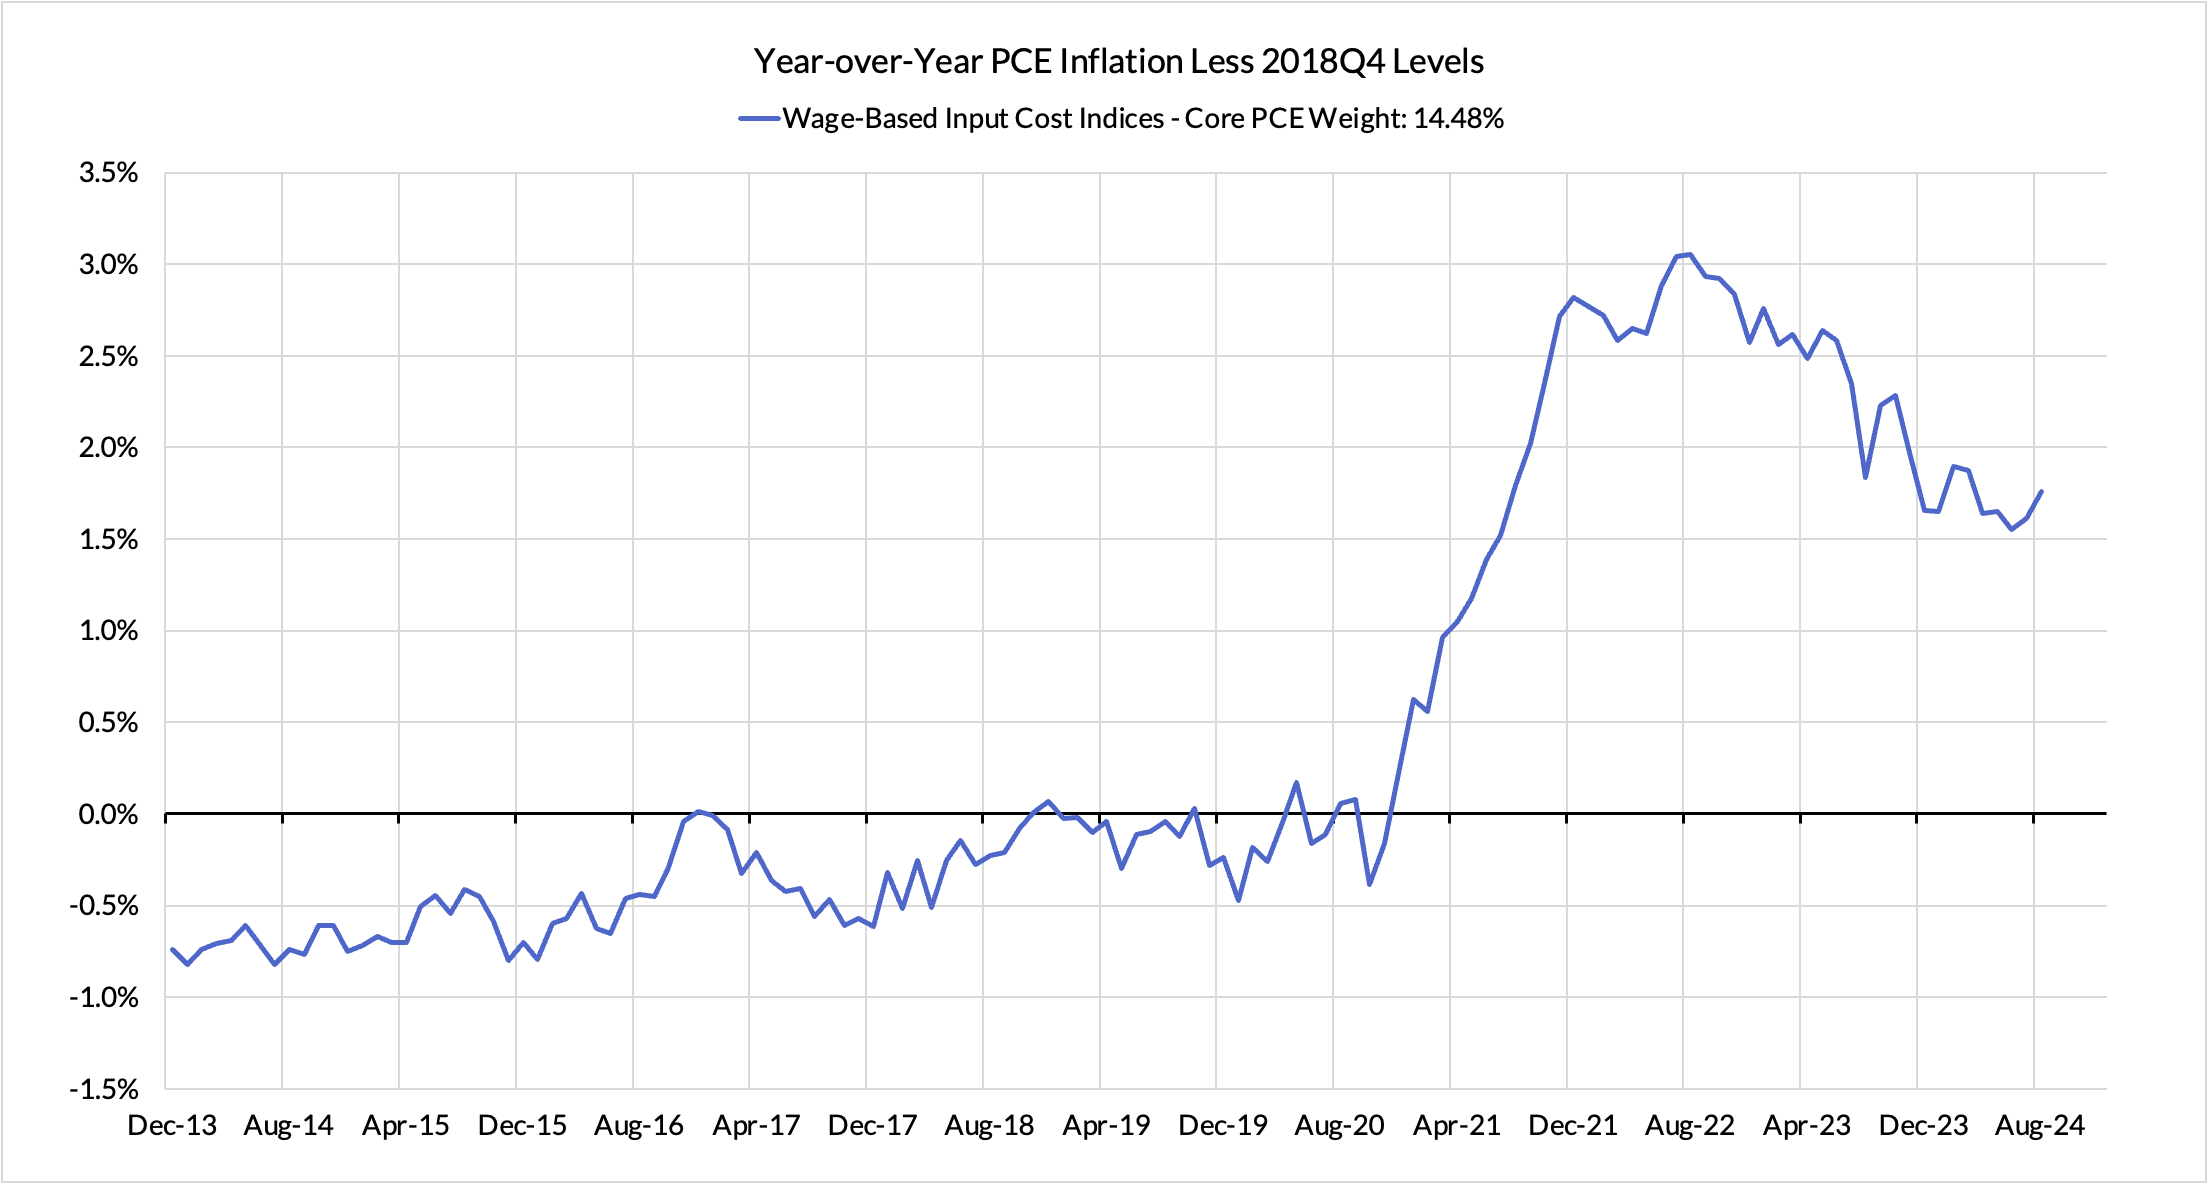
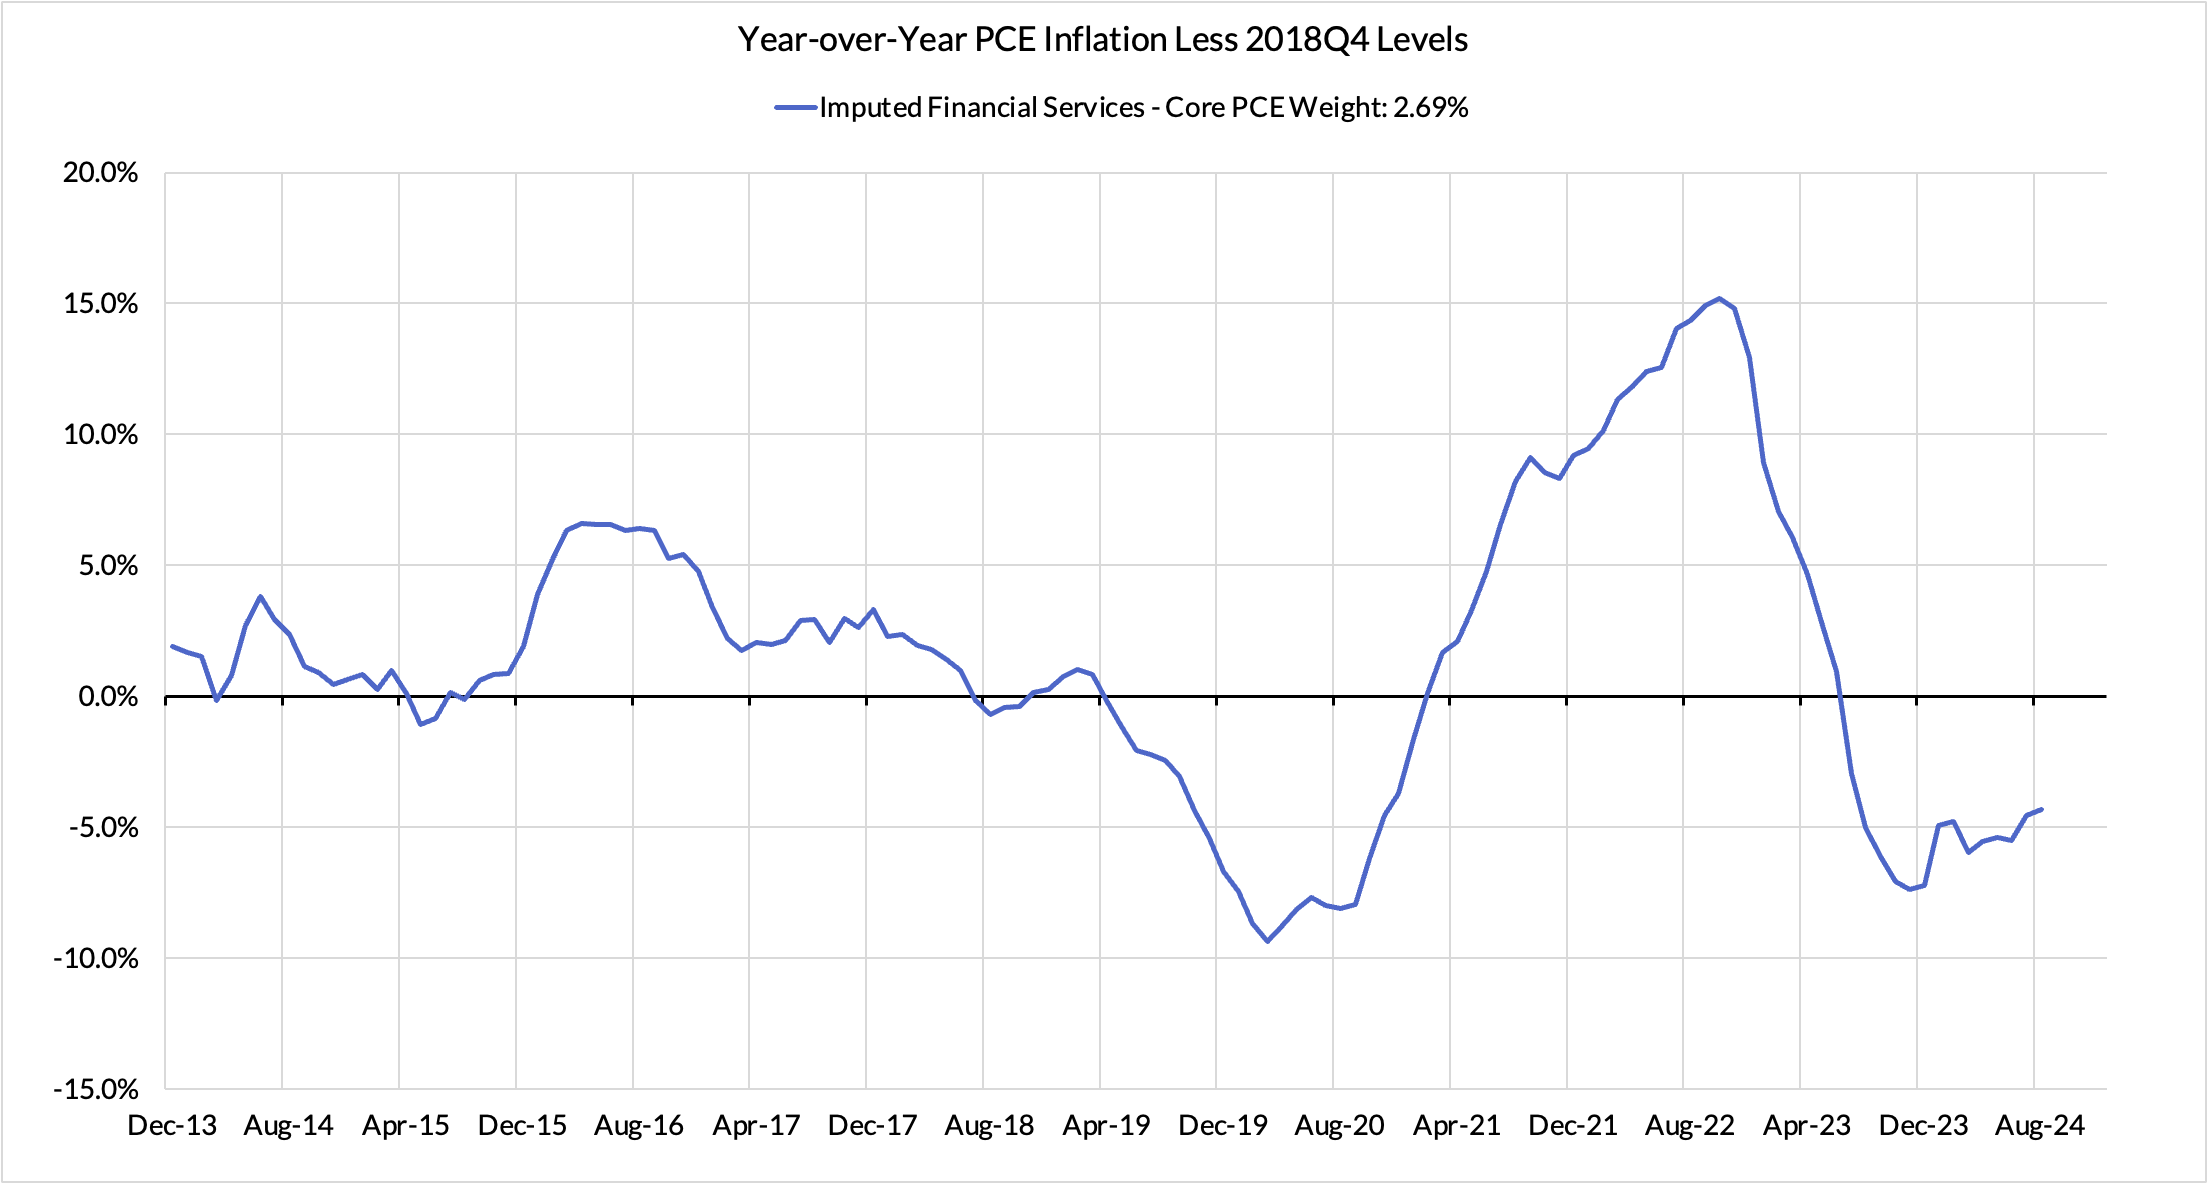
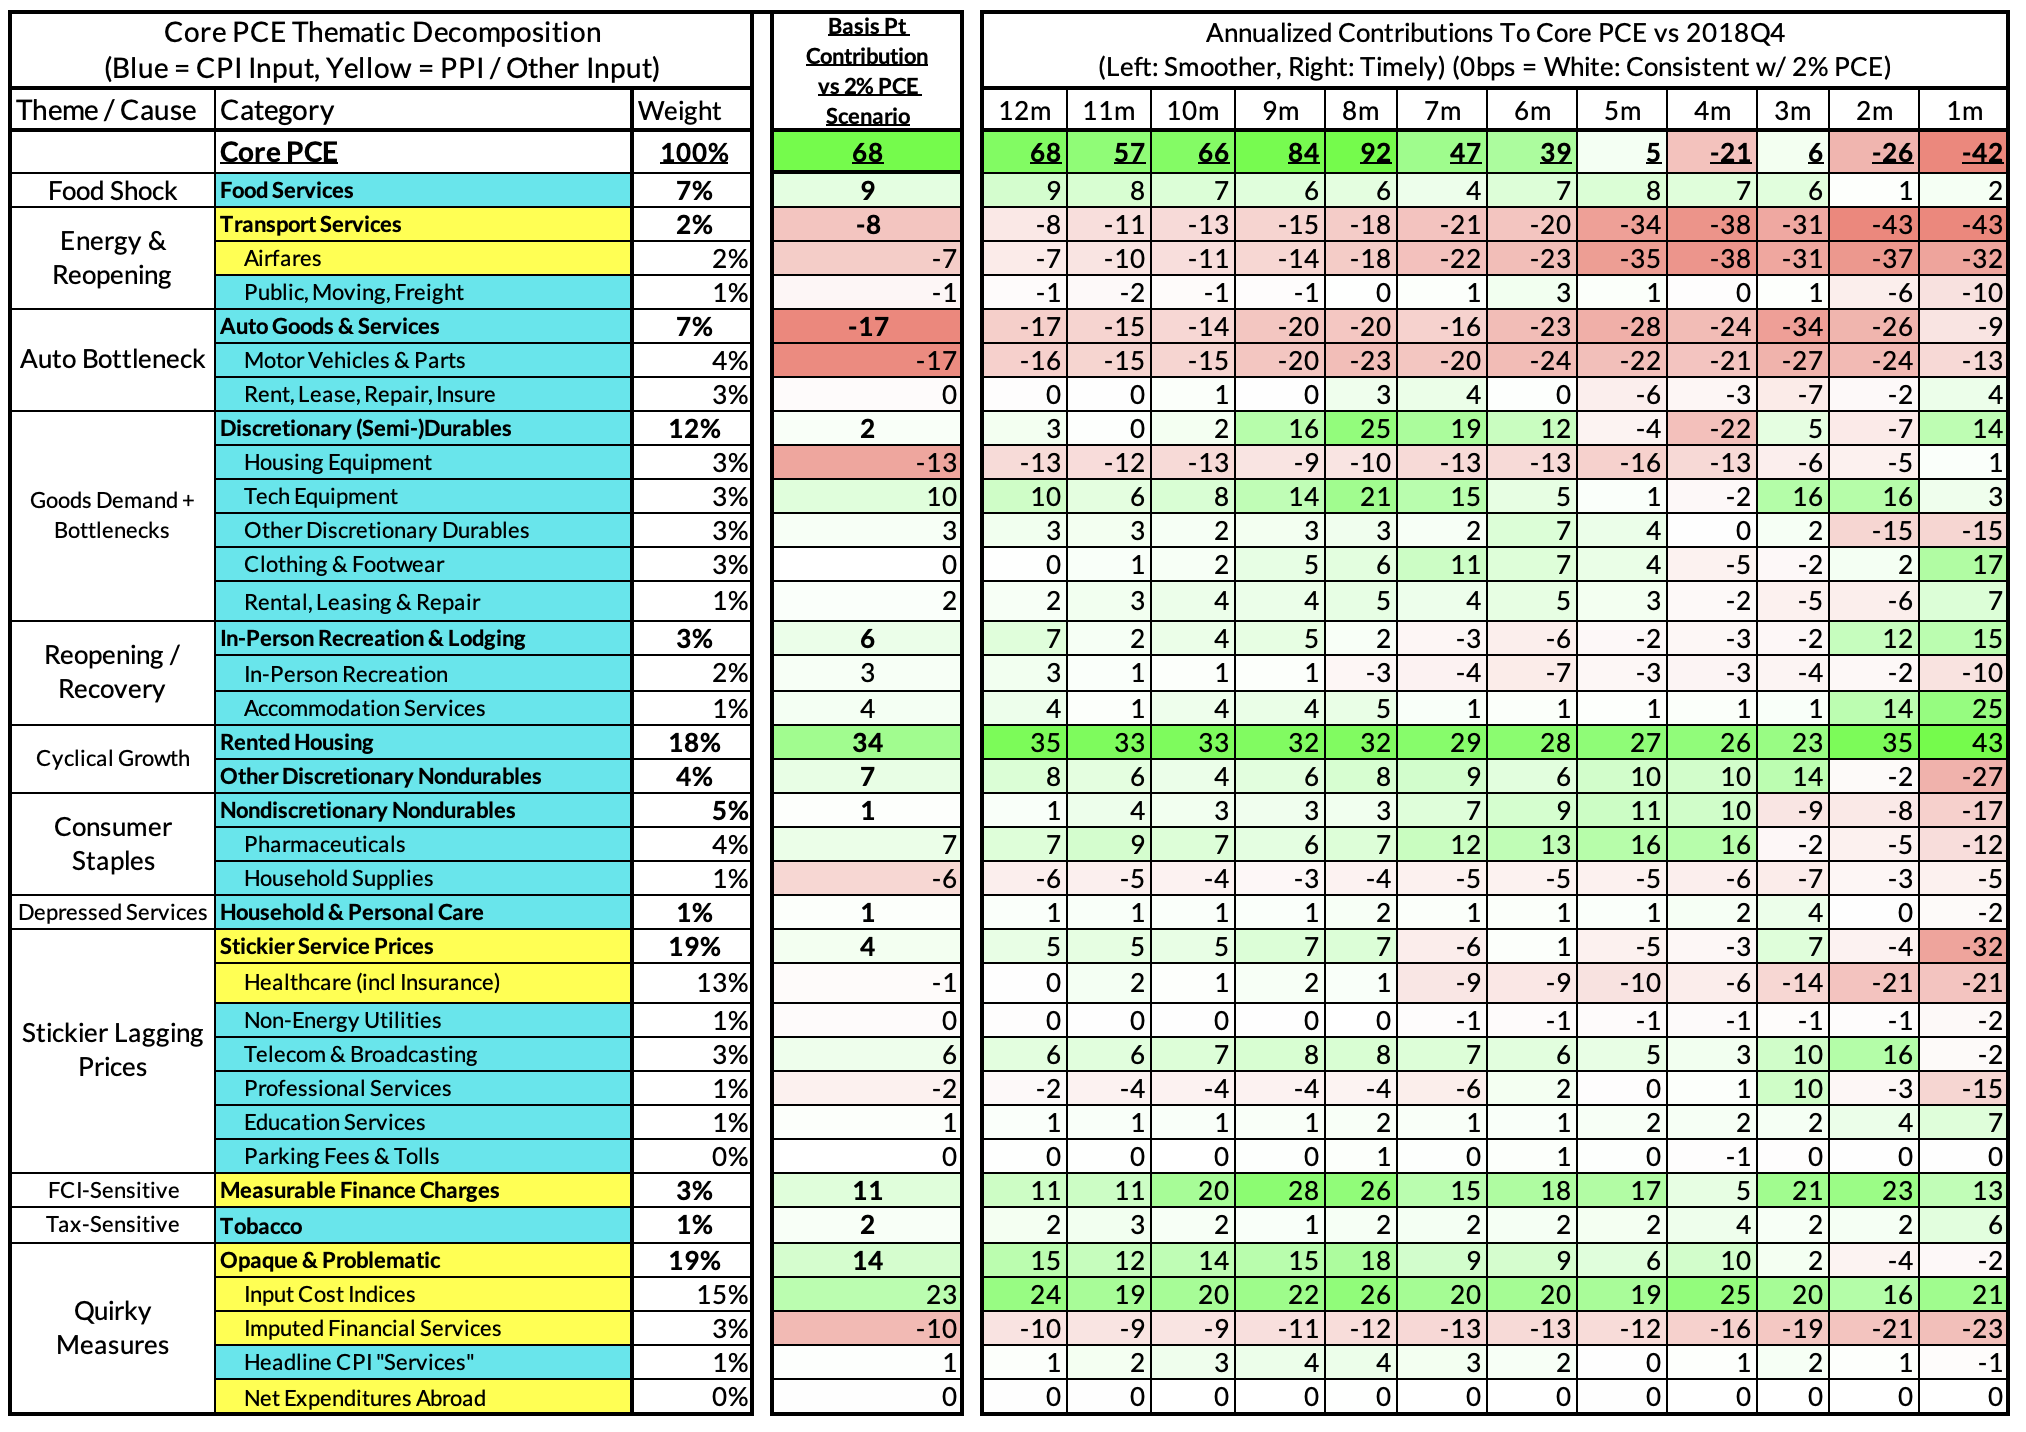
- Some oddball segments have offsetting effects (measured financial service charges now likely adding 11 basis points, while contributions from input cost indices and imputed financial services likely adding 13 basis points to Core PCE vs 2%-consistent outcomes).
The subsequent heatmap below gives you a sense of the overshoot on shorter annualized run-rates. August monthly annualized Core PCE ran at a 1.58% annualized pace, a 42 basis point undershoot vs 2% target inflation.
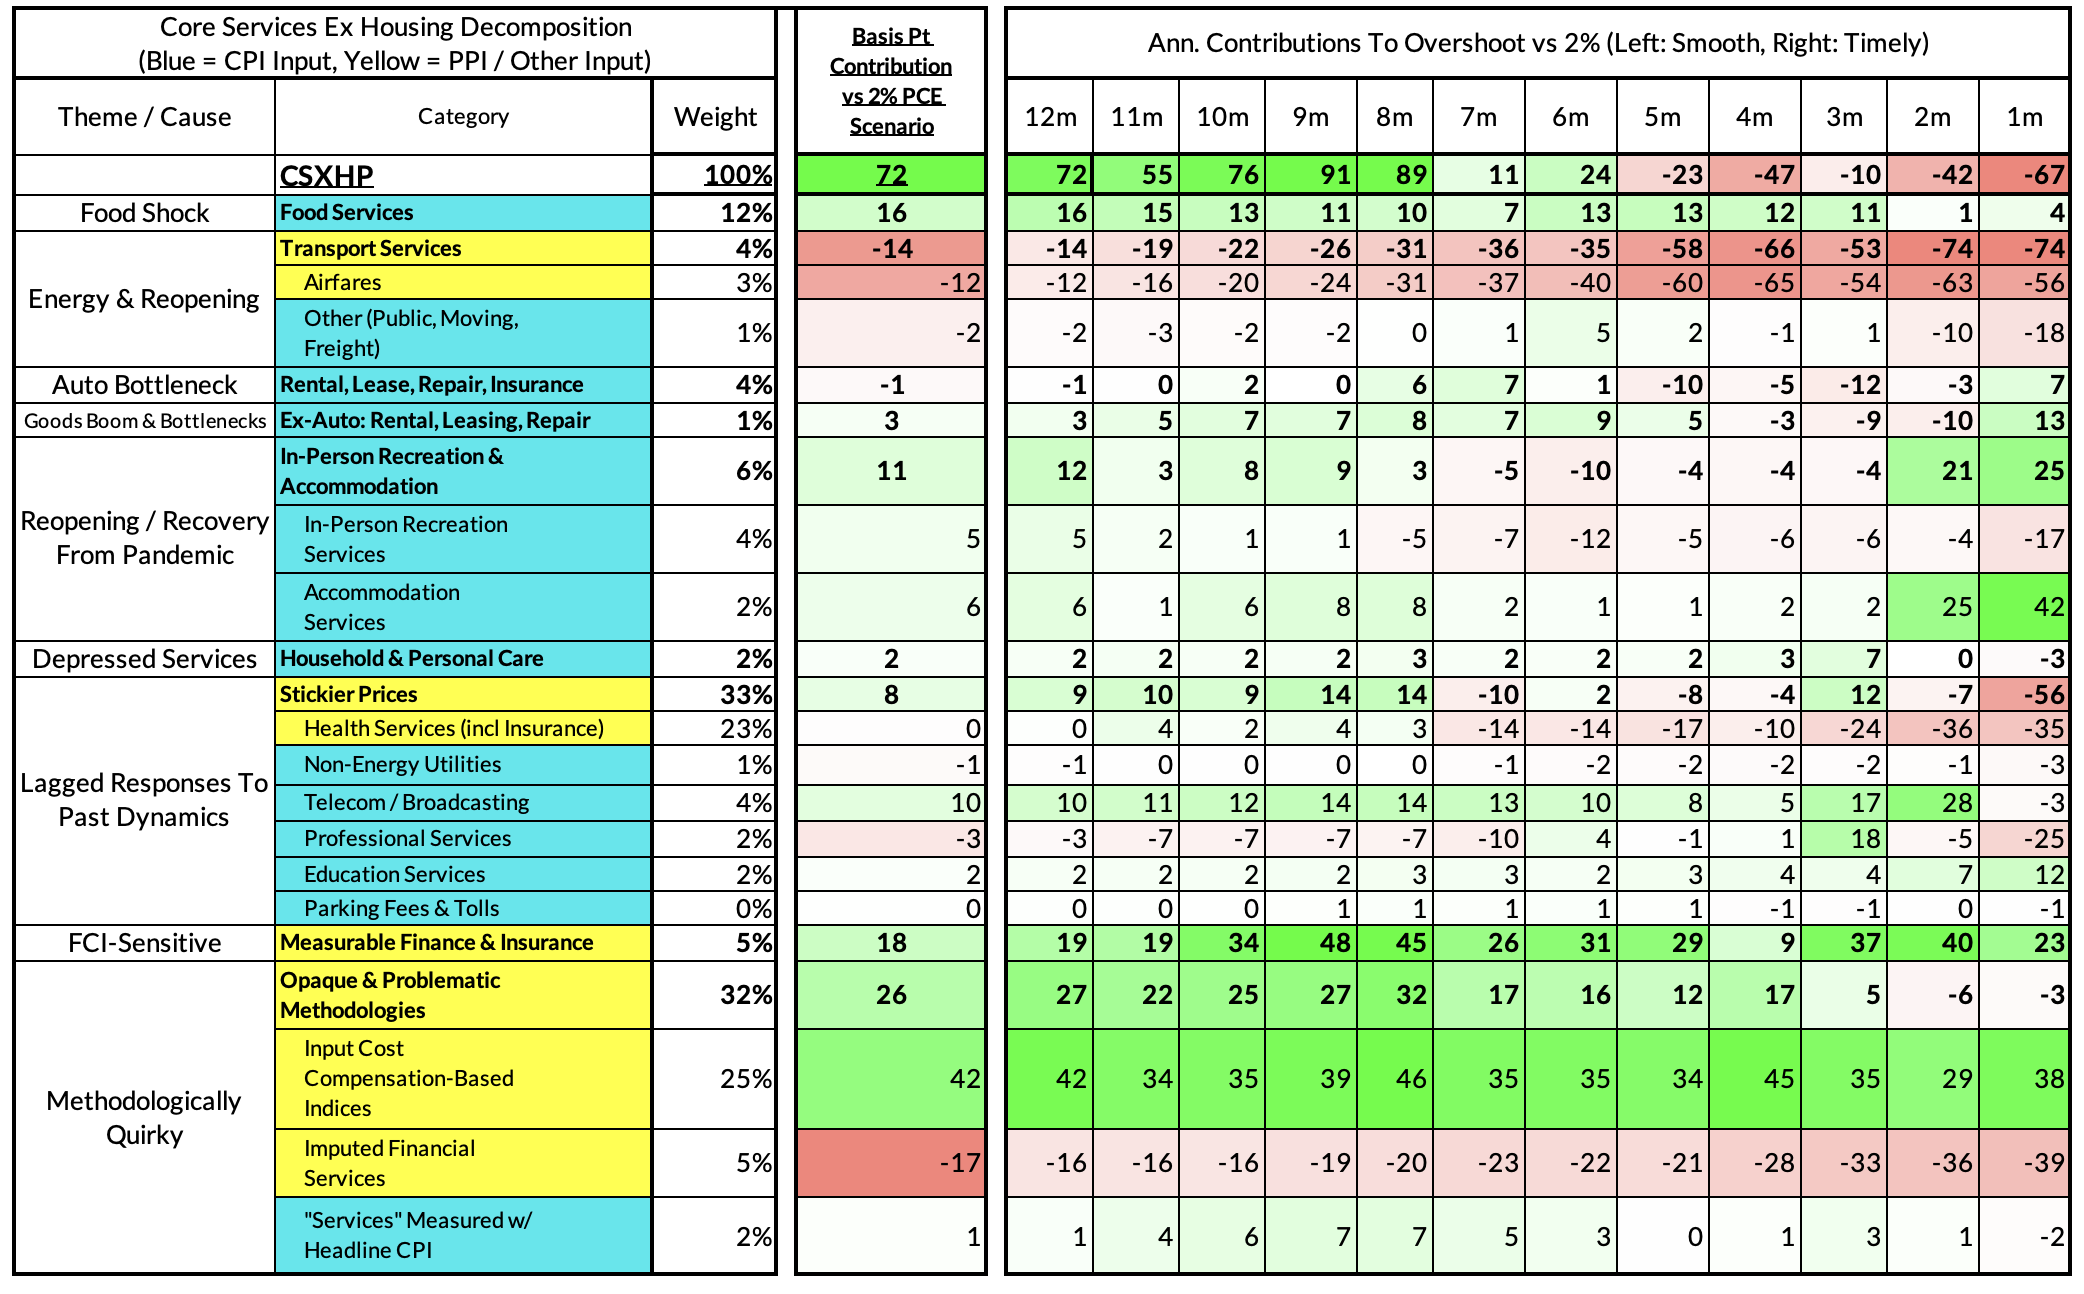
For the Detail-Oriented: Core Services Ex Housing PCE Heatmaps
The August growth rate in "Core Services Ex Housing" ('Supercore') PCE is running at a 3.30% year-over-year pace, an 72 basis point overshoot versus the ~2.59% run rate that coincided with ~2% headline and Core PCE.
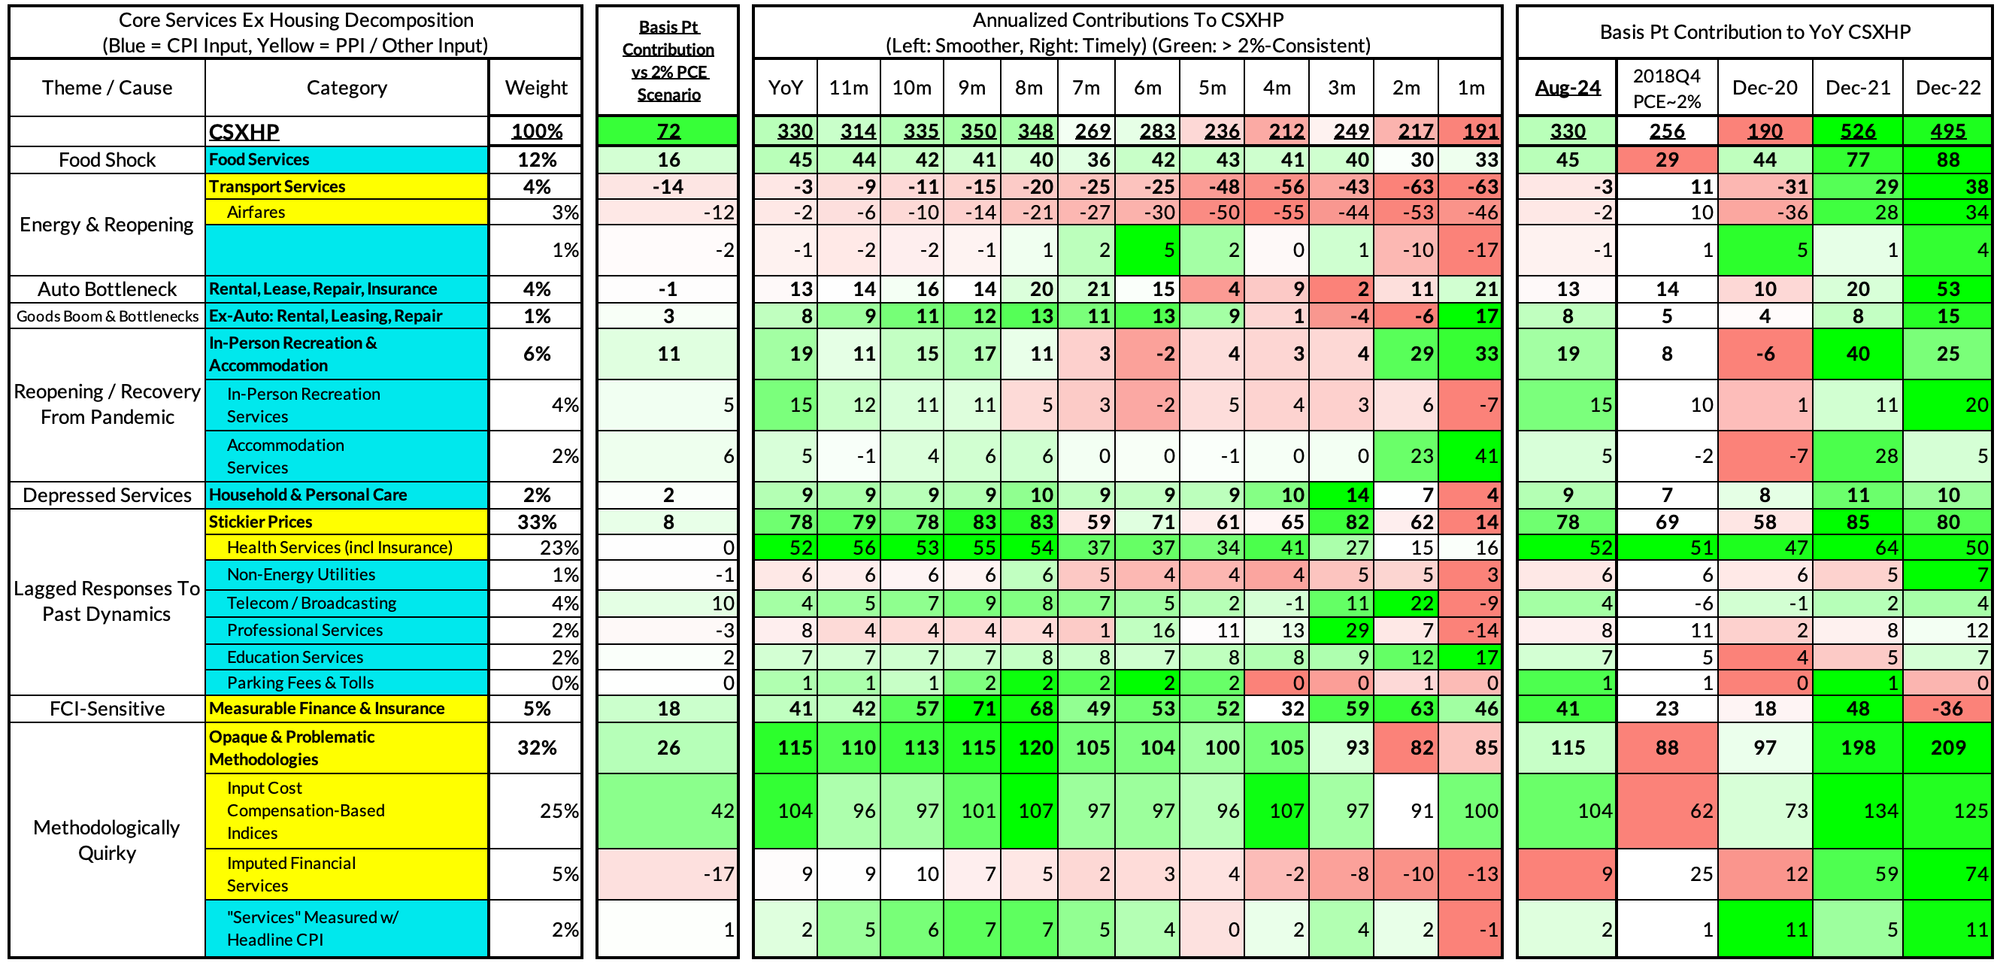
August monthly supercore ran at a 1.91% annualized rate, a 72 basis point annualized undershoot of what would be consistent with 2% Headline and Core PCE.