Core-Cast is our nowcasting model to track the Fed's preferred inflation gauges before and through their release date. The heatmaps below give a comprehensive view of how inflation components and themes are performing relative to what transpires when inflation is running at 2%.
If you'd like to start a 90-day free trial of our exclusive content, you can do so usingthis link. If you have any questions or would like to see samples of our past content, feel free to get in touch with us.
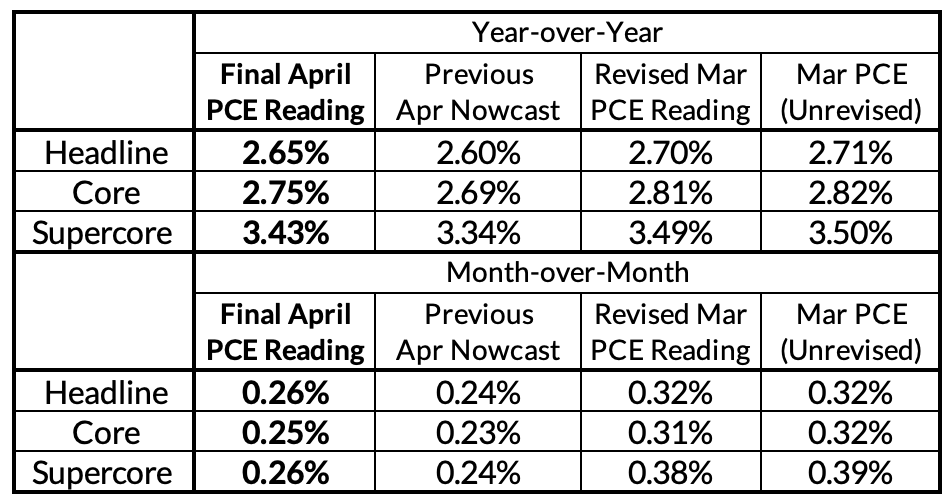
Summary: Final Readings For PCE
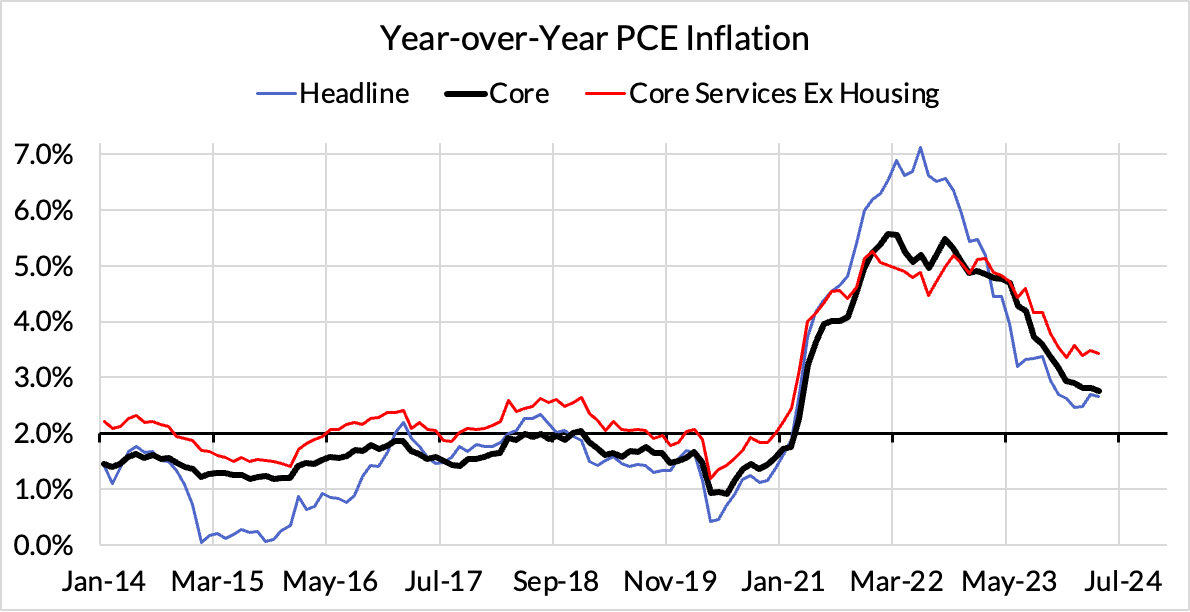
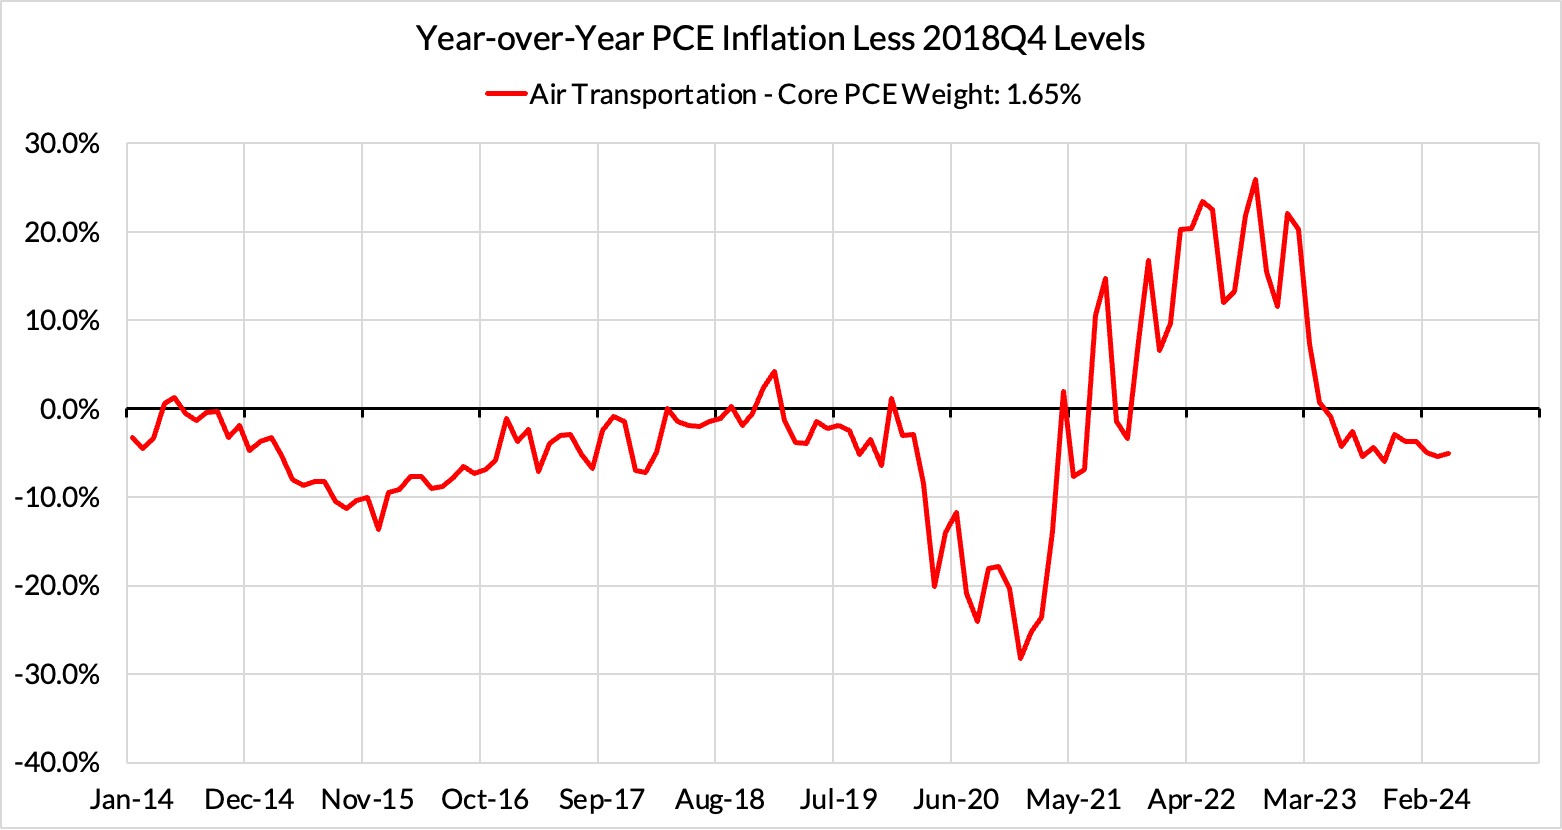
Our nowcasts were a little under-baked as a result of presuming too much of a decline in food services and airfares (seasonal factor translation issue), and an imperfect mapping of yesterday's revisions to the Q1 PCE data. Nevertheless, year-over-year readings across all major PCE inflation gauges fell from March to April as last year's higher monthly inflation readings continue to roll off.
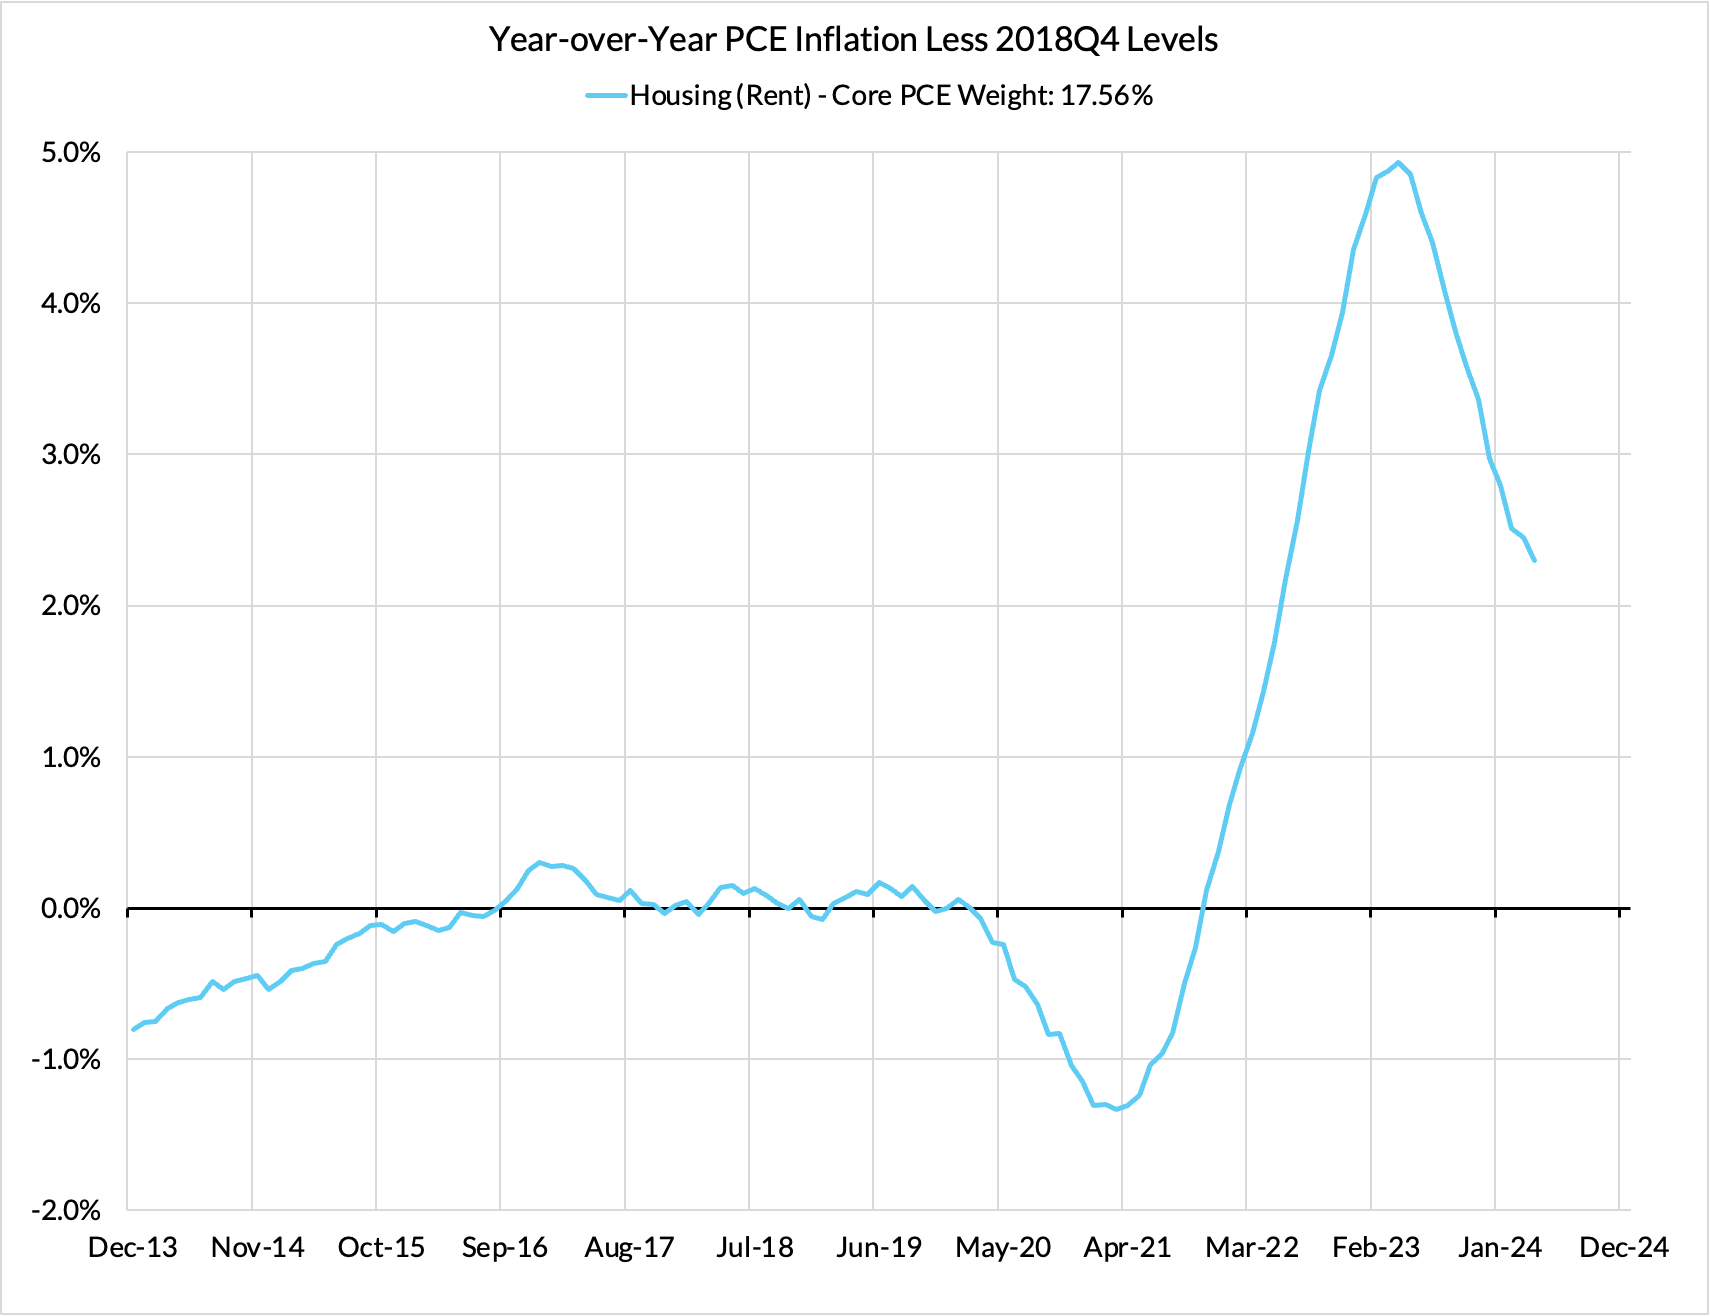
Core PCE still remains 75 basis points above the Fed's 2% target, but most of this overshoot is about the BLS' measures of rented housing inflation (including Owners' Equivalent Rent). To the extent other components are worth flagging for the year-over-year overshoot, food services, measured financial service charges, and flawed wage-based input cost indices are secondary culprits.
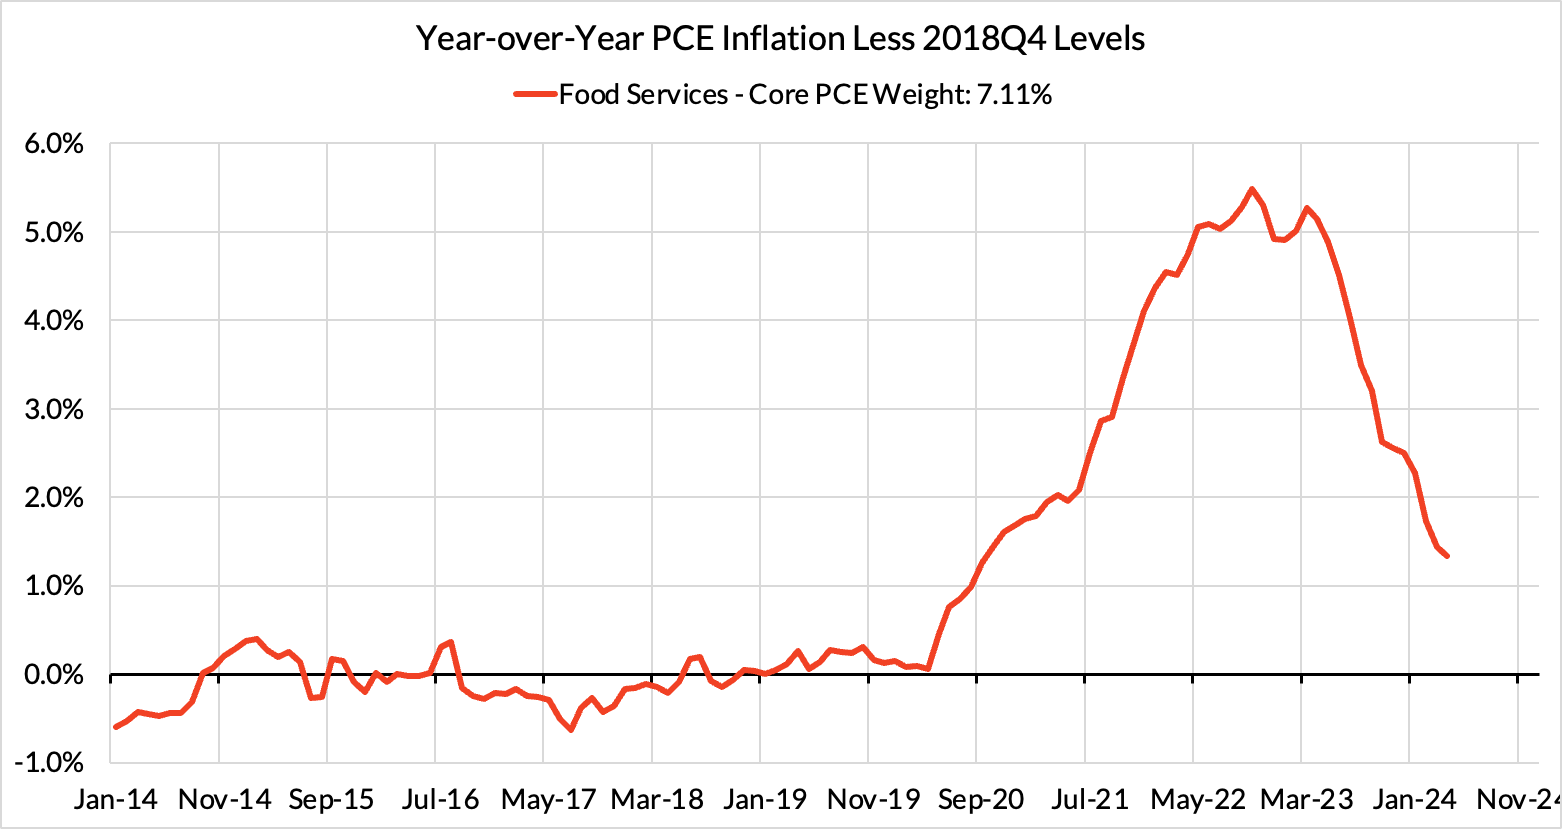
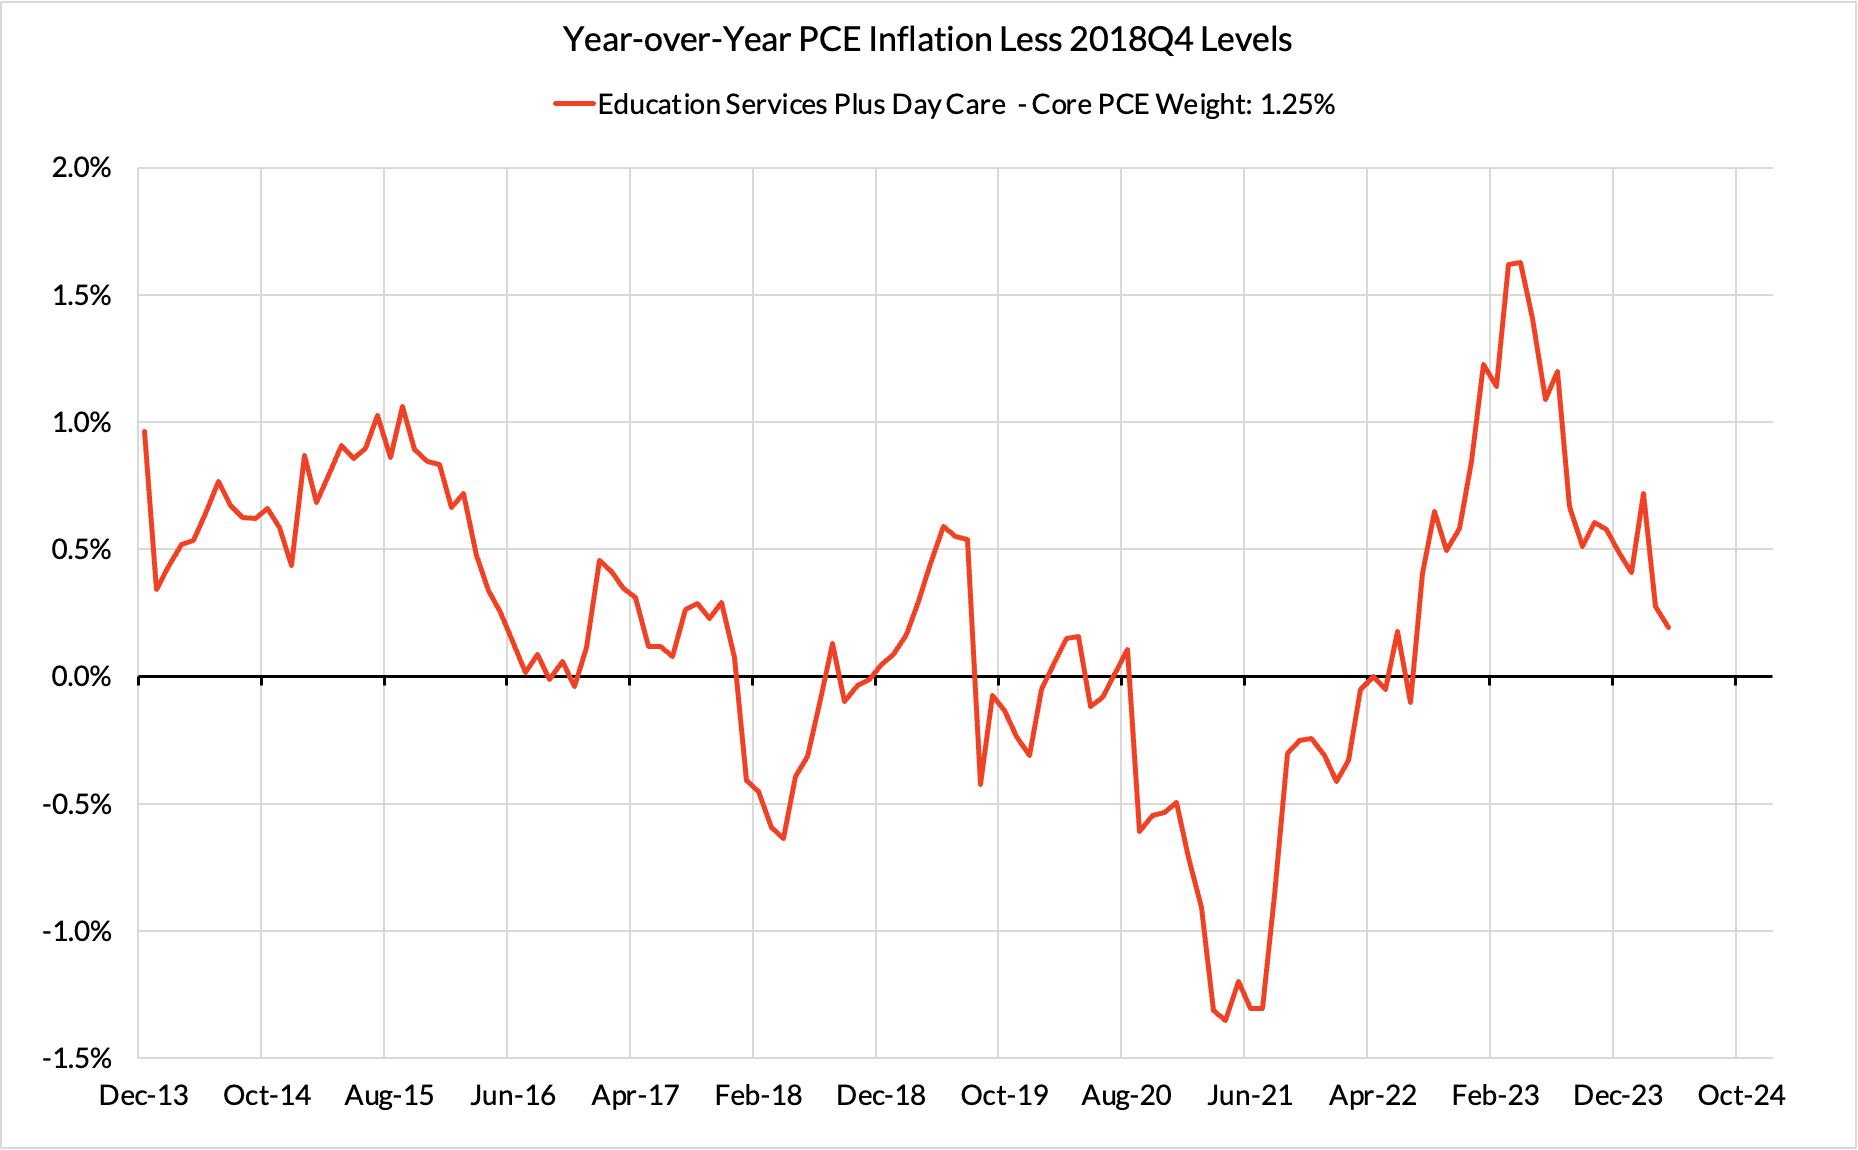
We expect to see more progress in food services inflation as the benefits stable commodity prices and falling food prices filter through.
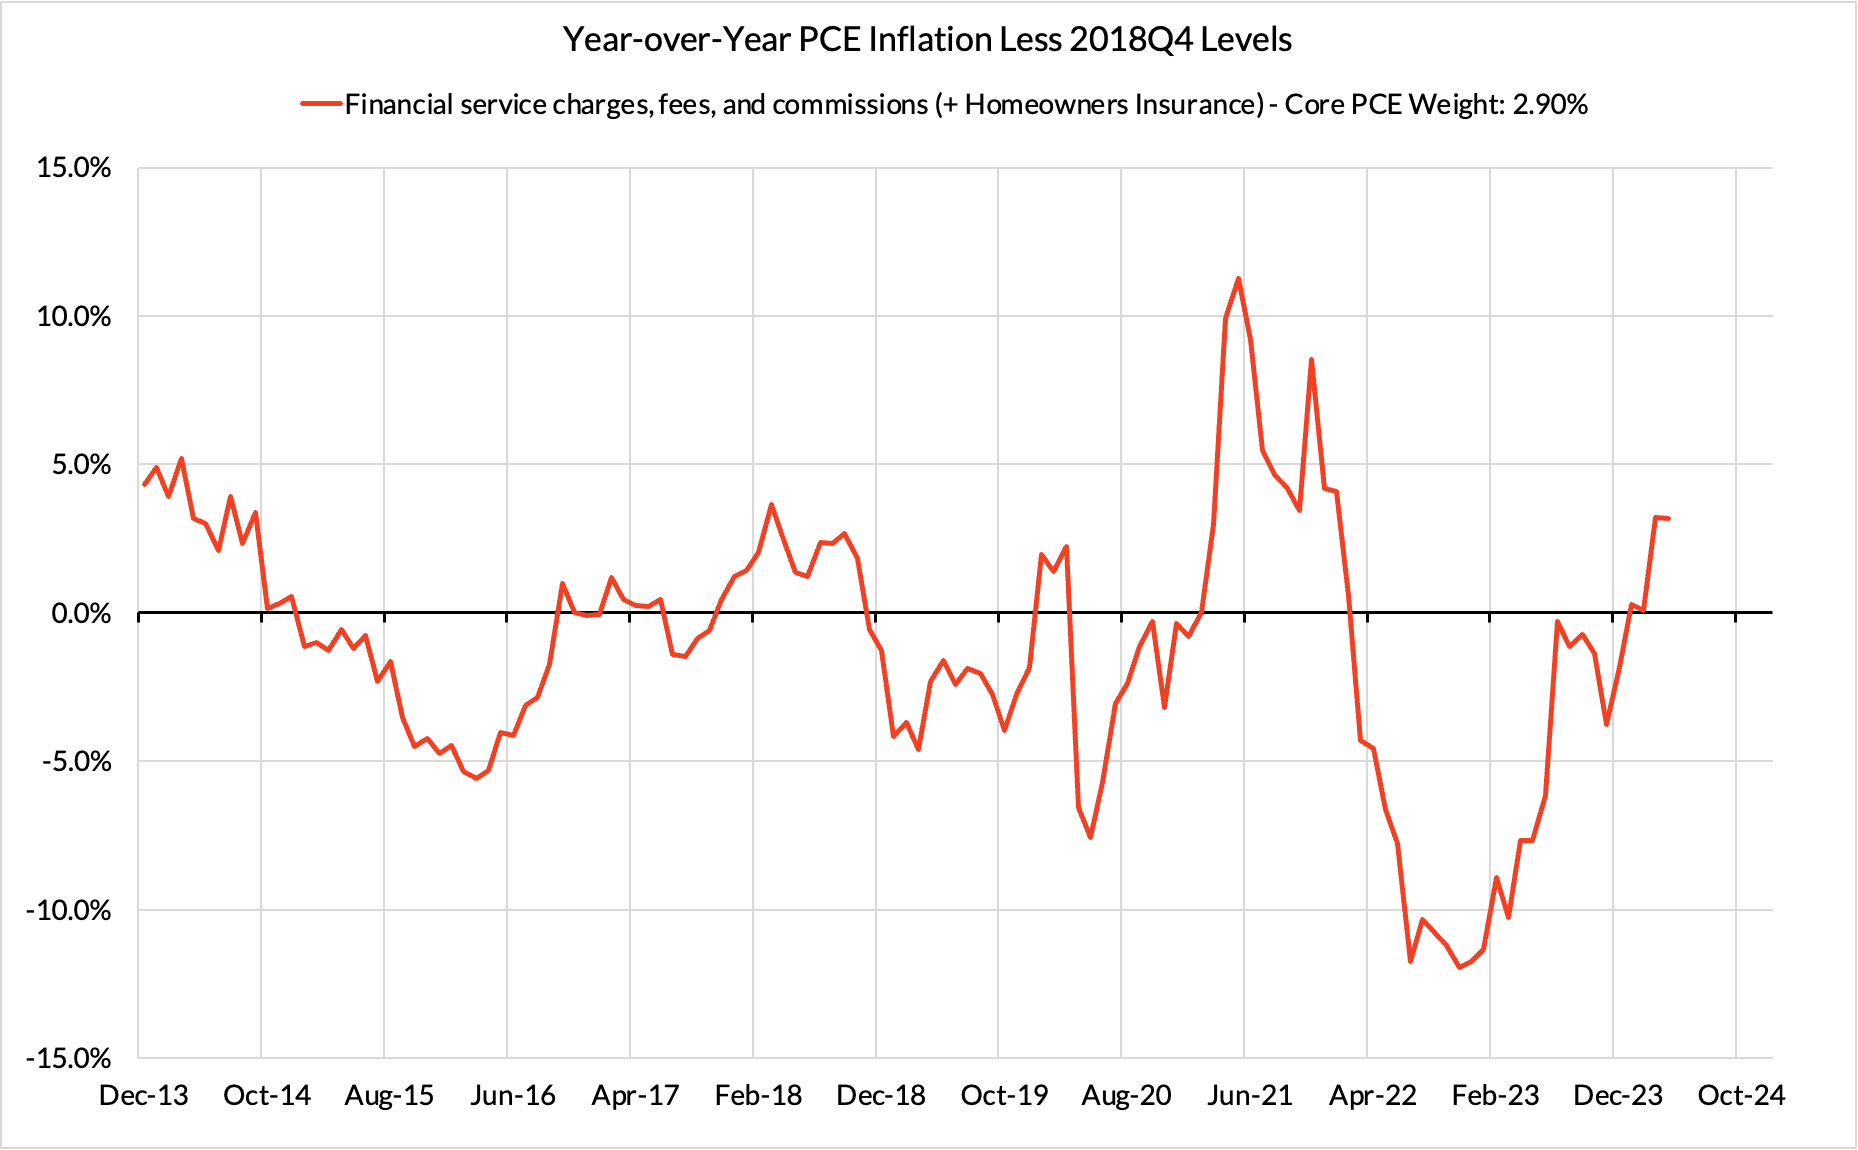
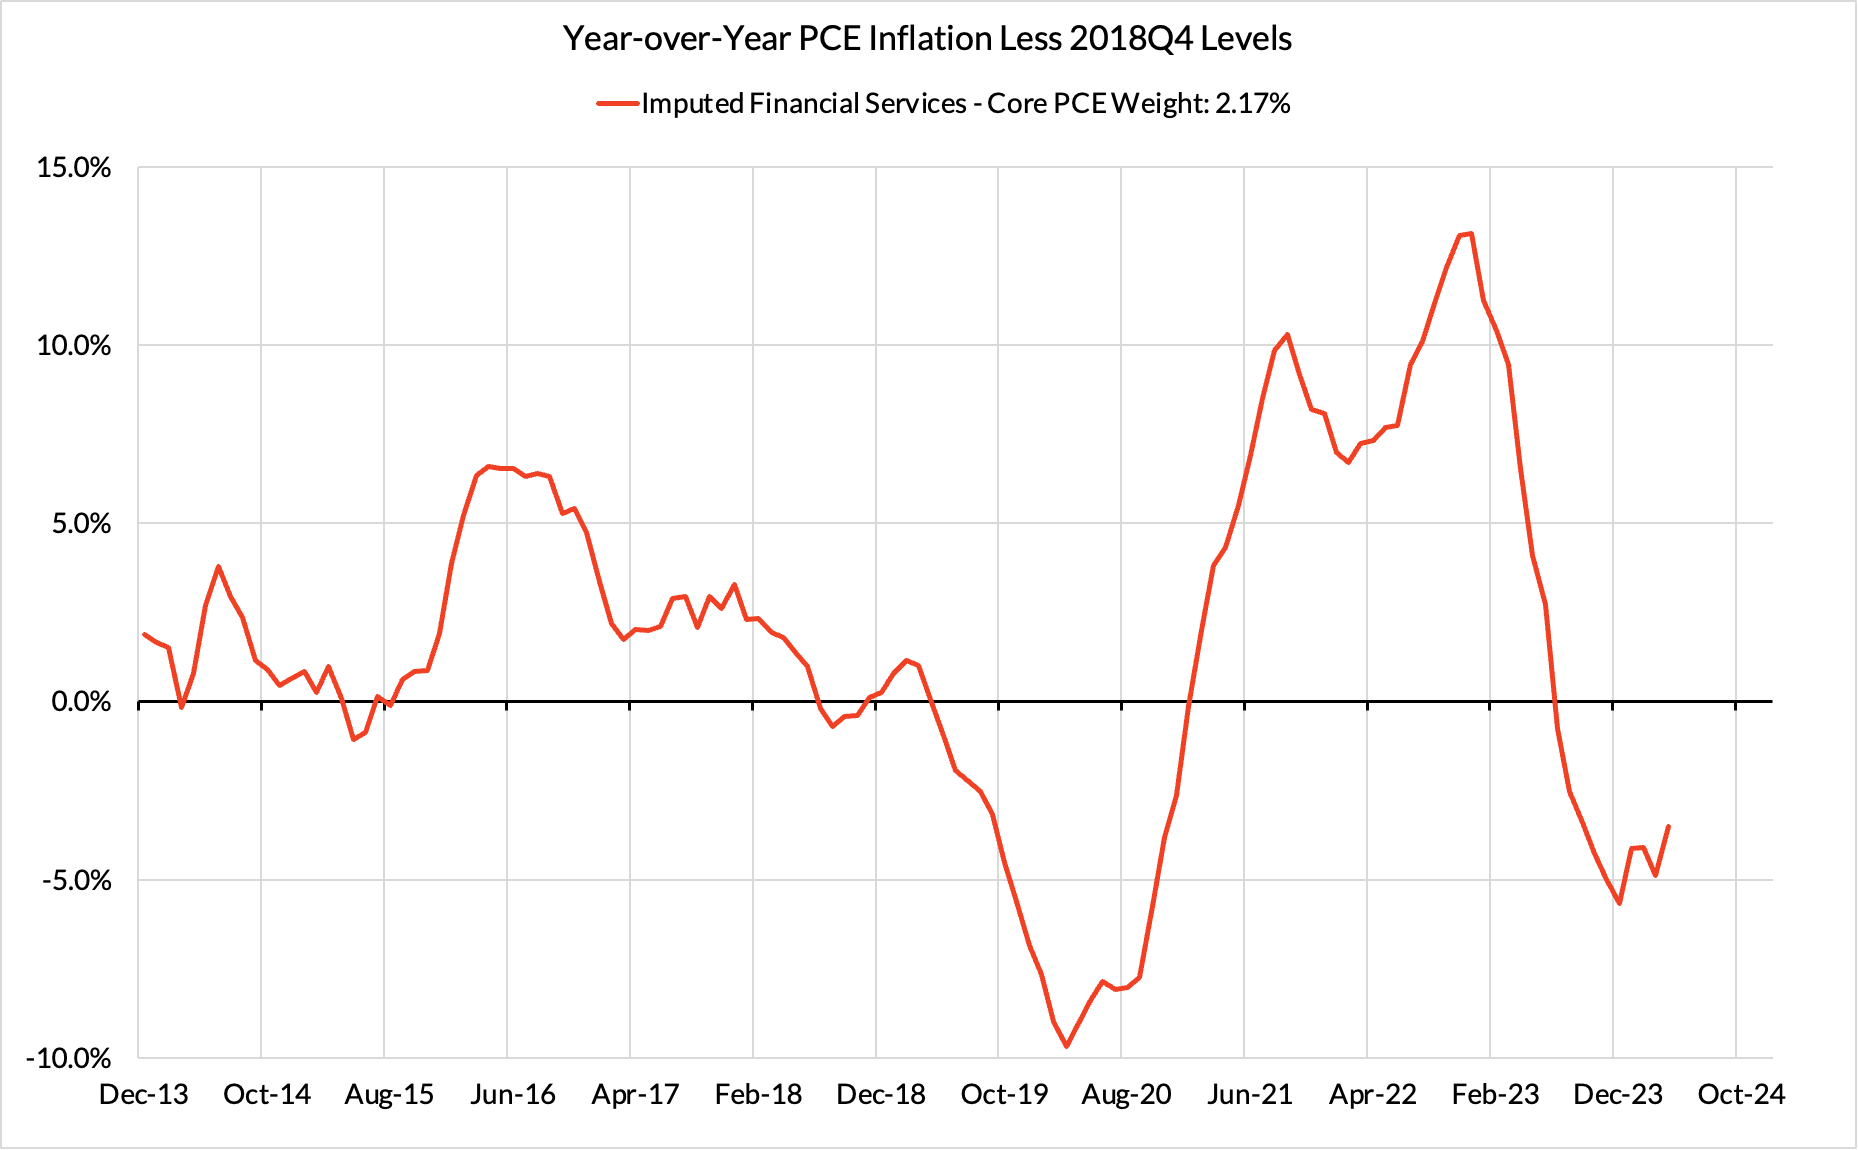
Measured financial service charges are primarily shaped by the pace of equity price appreciation; should the recent slowing of appreciation continue, it would help ensure a more target-consistent financial services inflation outcome.
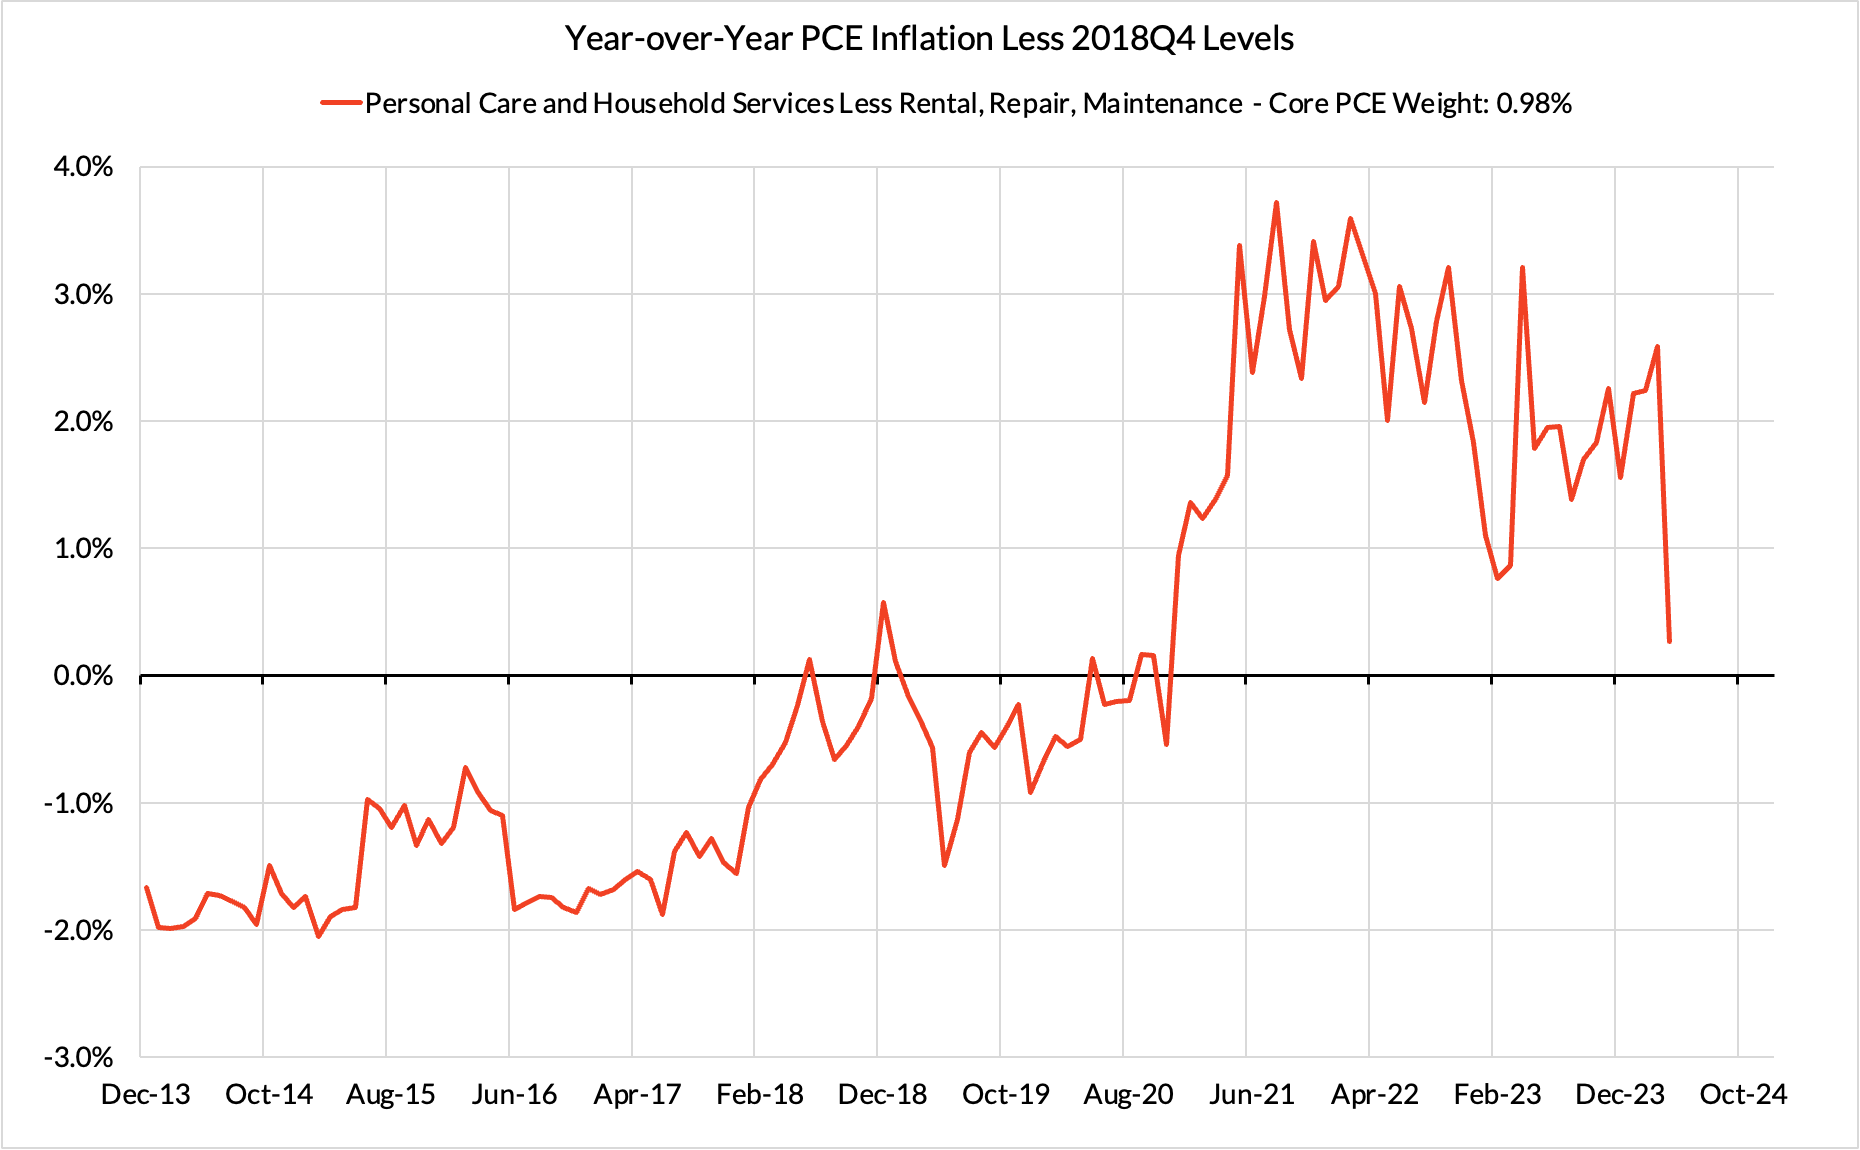
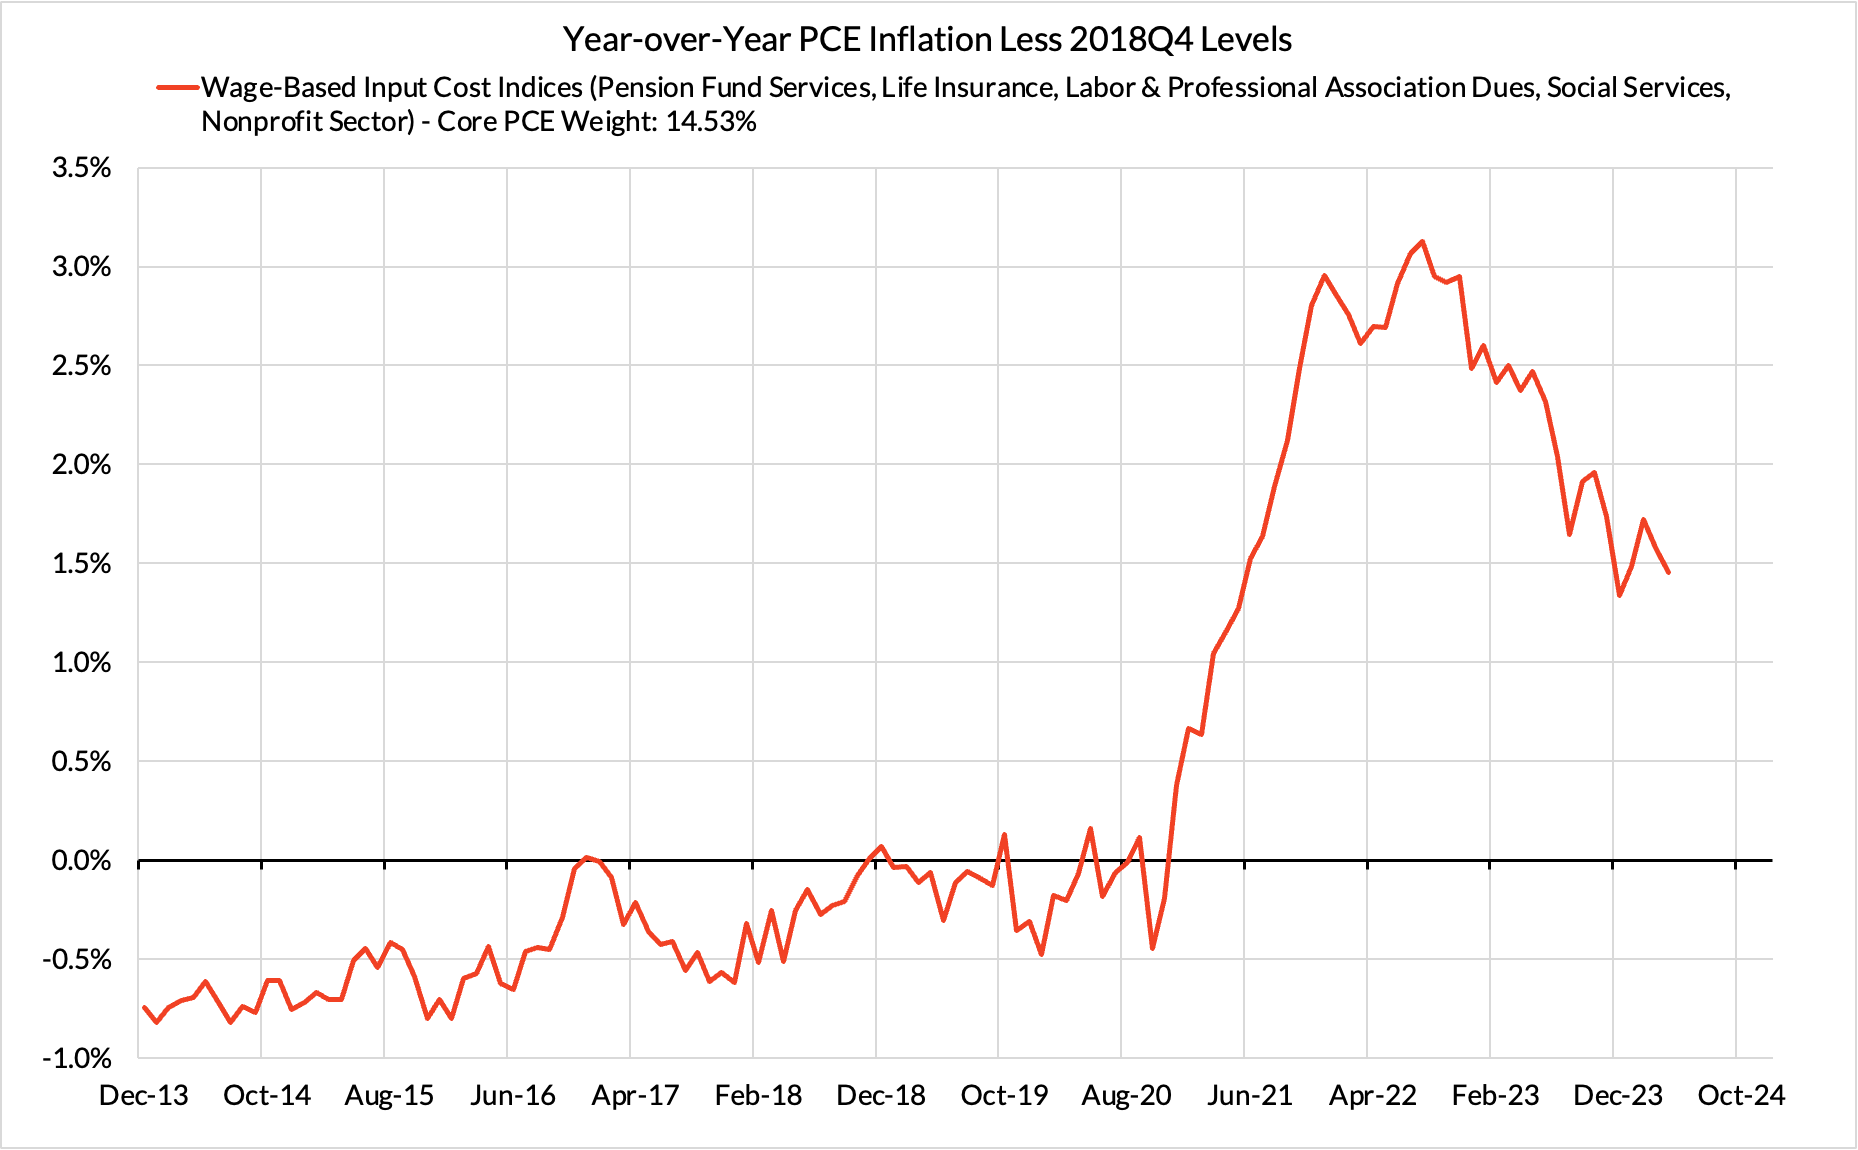
Flawed wage-based input cost indices for a smattering of social service and nonprofit segments are also running strong on a year-over-year basis, though here too, we are seeing the normalization of labor market dynamics and wage growth incrementally filter through.
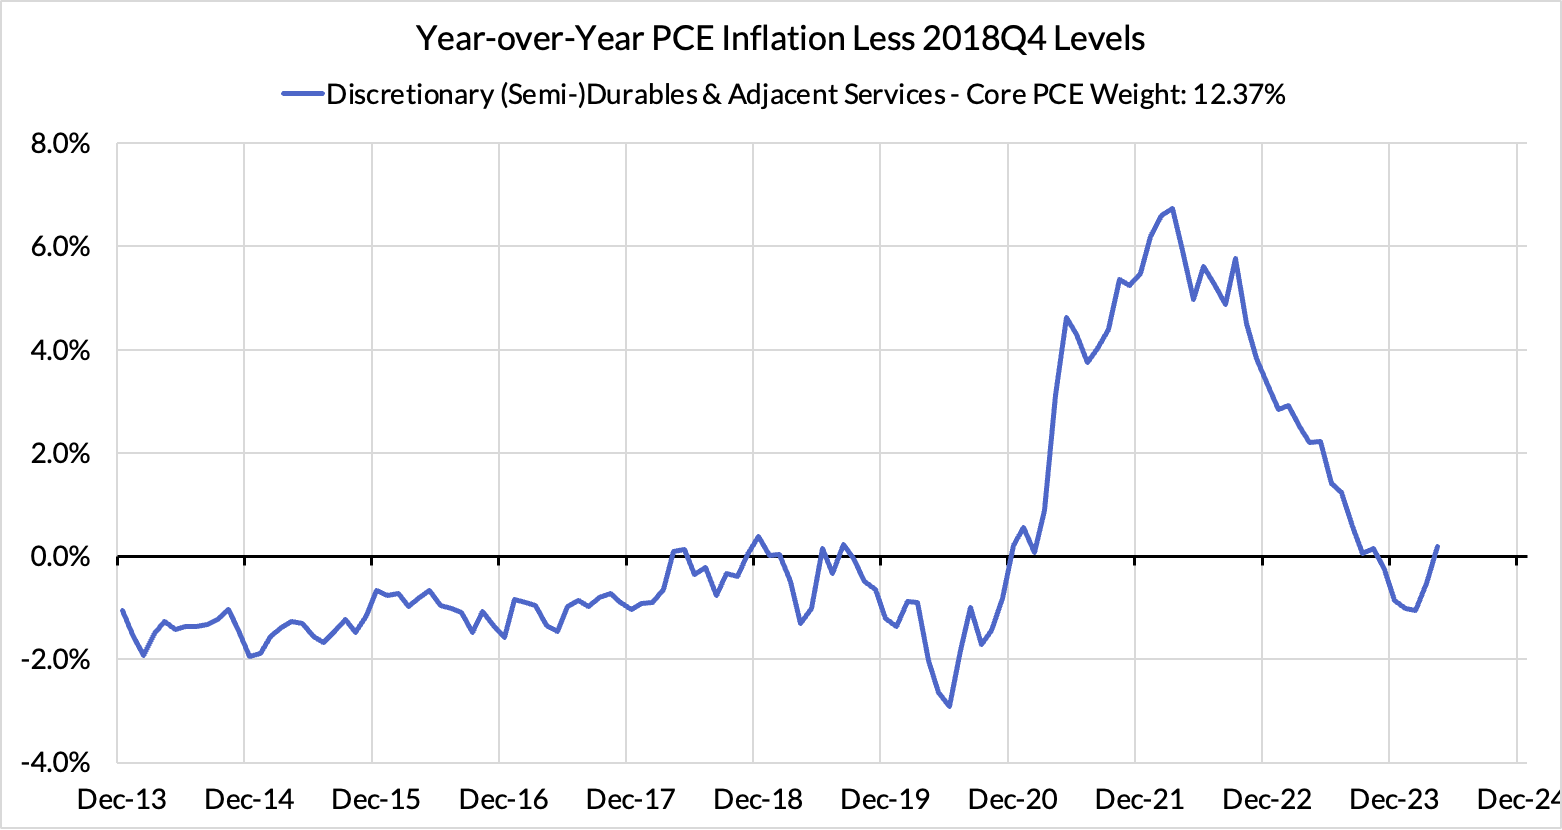
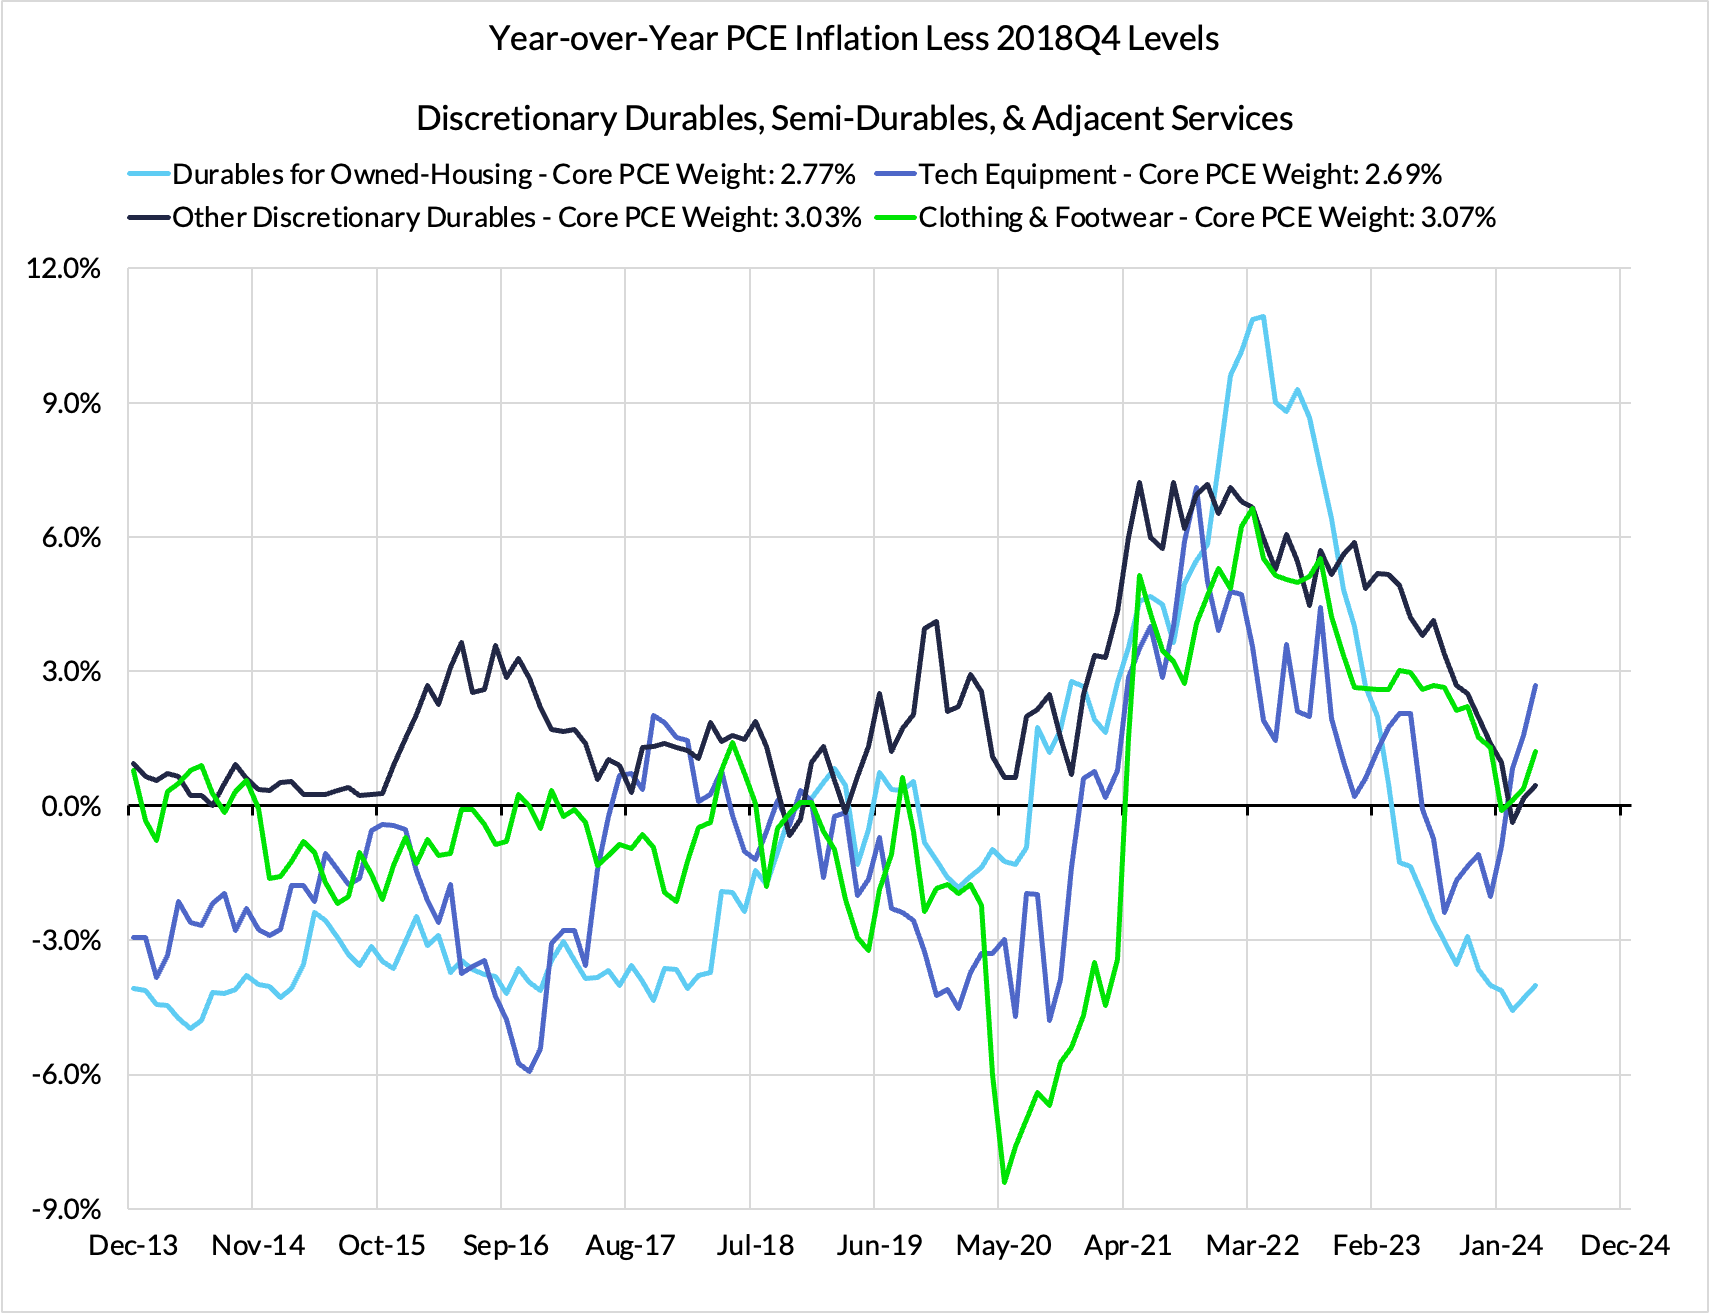
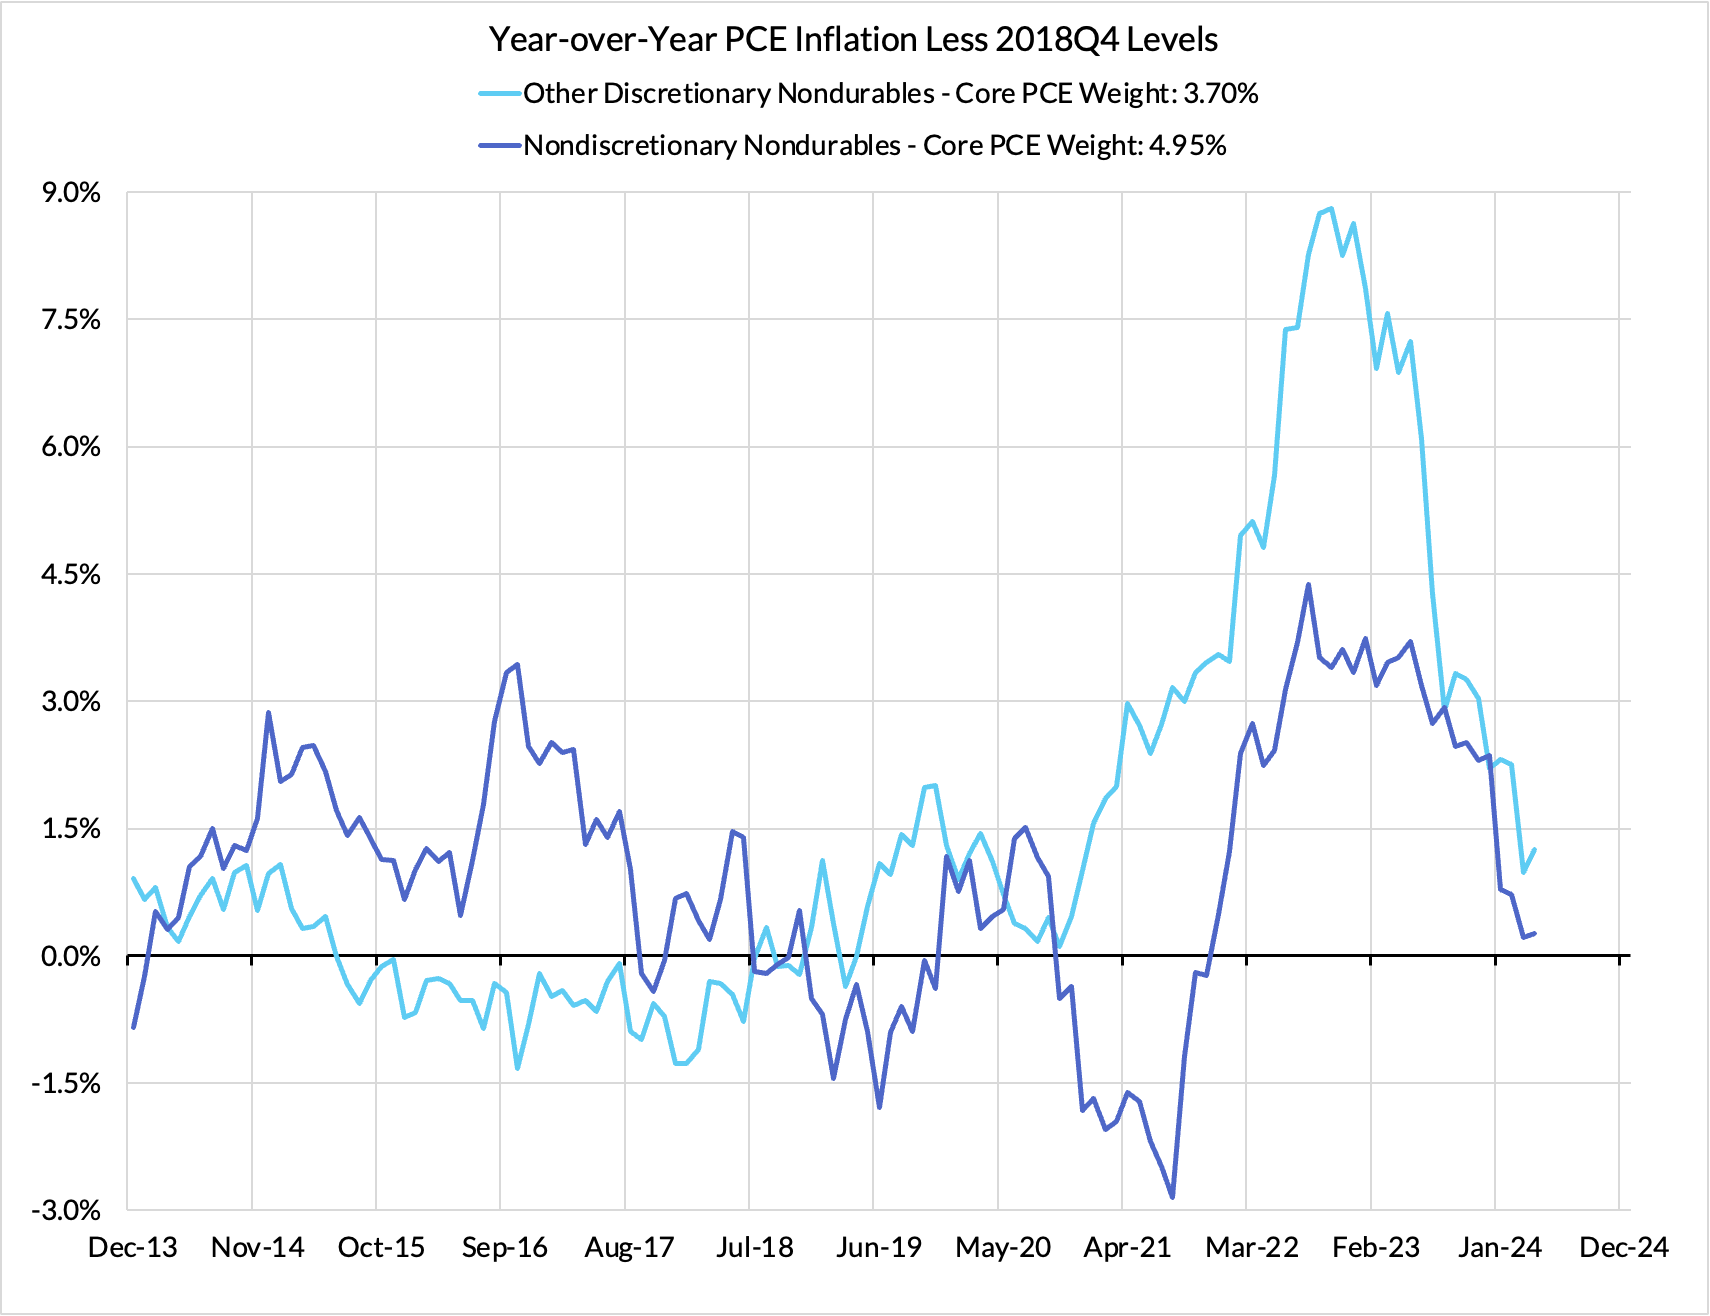
There are other segments of PCE inflation that have run strong to start 2024, particularly within goods. Apparel inflation has run strong, though the highly seasonal nature of apparel pricing also drives much of its local volatility month to month and quarter to quarter. Information technology goods prices were rapidly deflating in the final two quarters of last year but the end of aggressive discounting has translated into stronger inflation in Q1. Overall, core goods pricing has ran at a satisfactory pace for Core PCE to hit 2%, provided that core services pricing show more signs of normalization.
The first four months of this year could have proceeded more helpfully for achieving 2% inflation outcomes but we still believe that the inflation trajectory is on the right track. We expect more visible progress across all of the major categories we previously discussed, but most importantly so for housing (rent and OER). Seeing is believing and should we see a meaningfully softer reading for rent and OER in the May and June CPI releases (along with cooler financial services, food services, and goods inflation), the prospects of a September interest rate cut will firm up more noticeably.
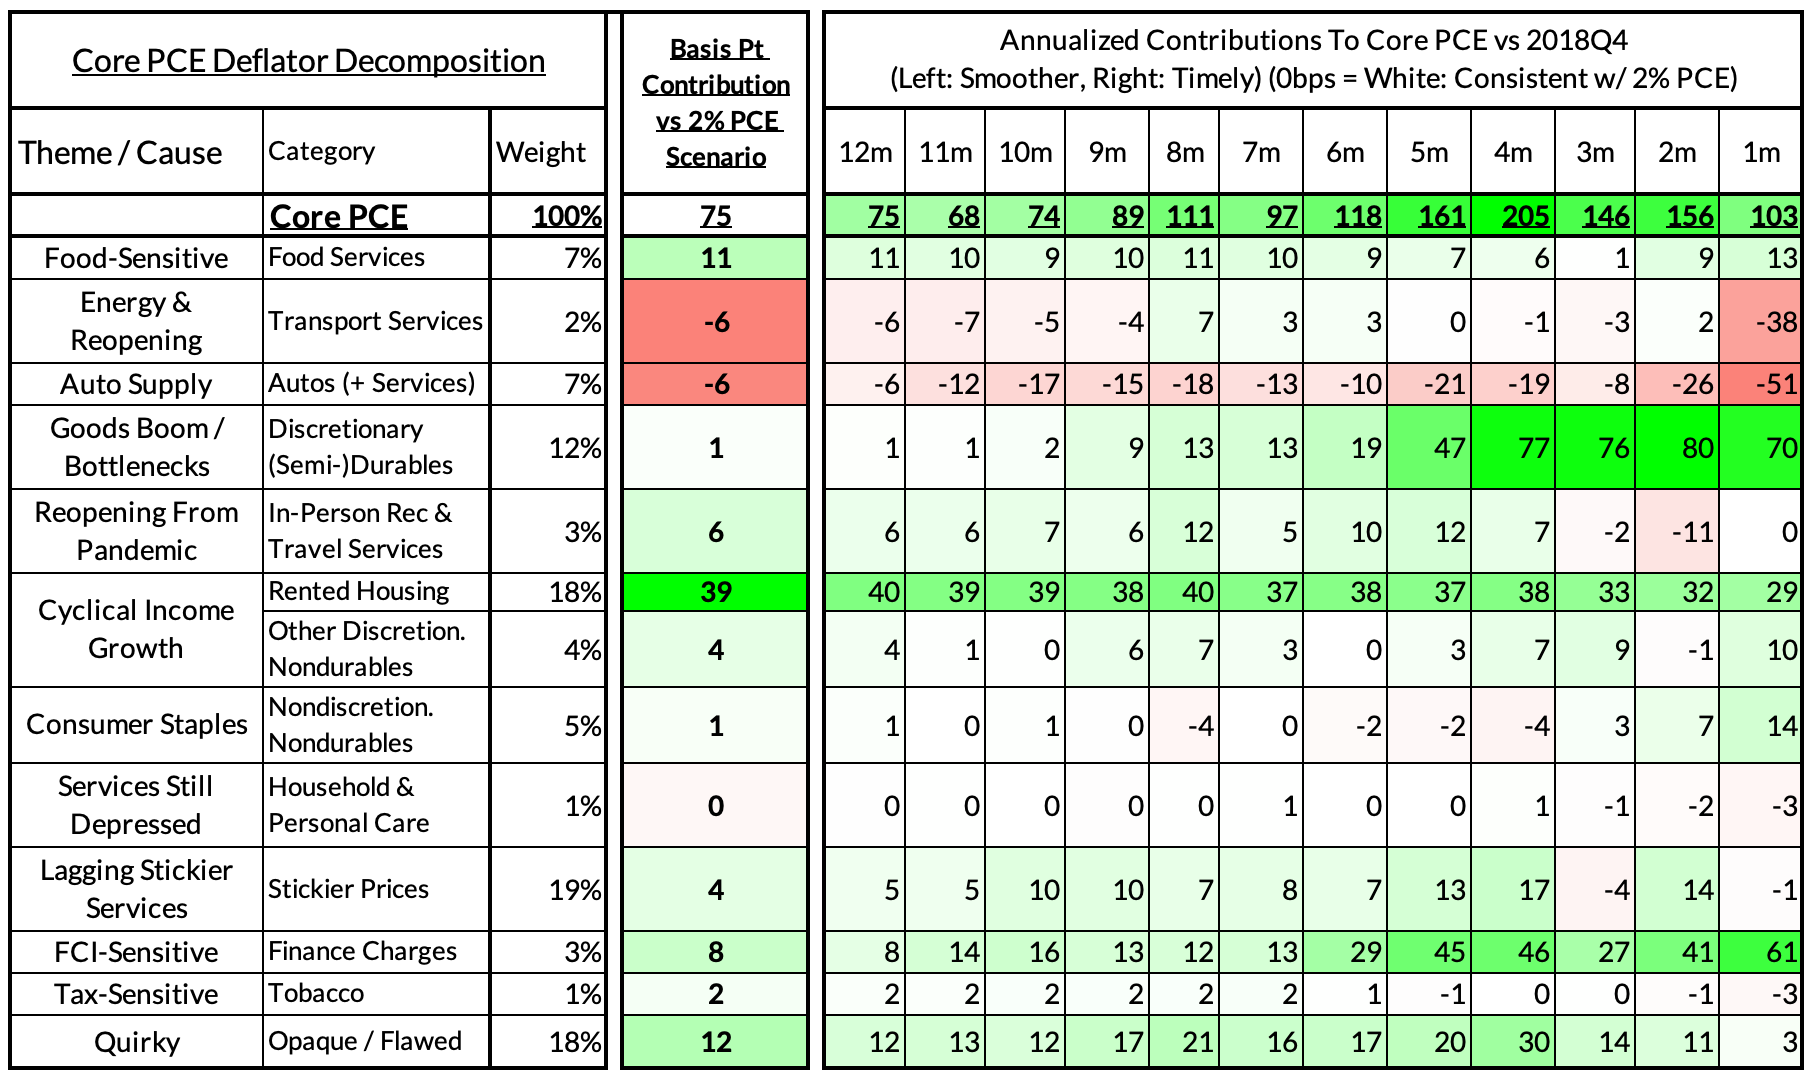
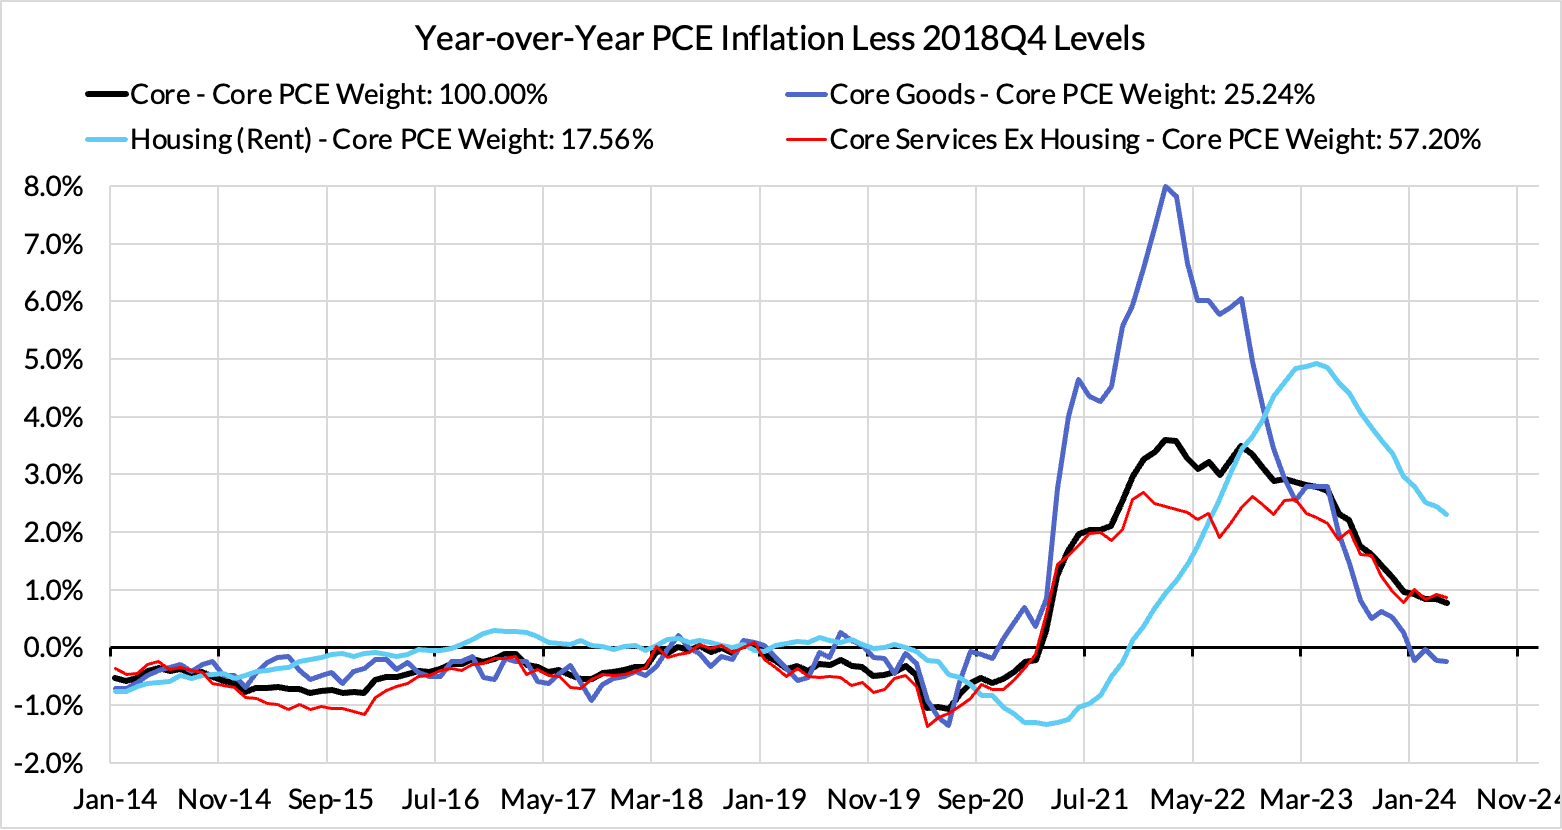
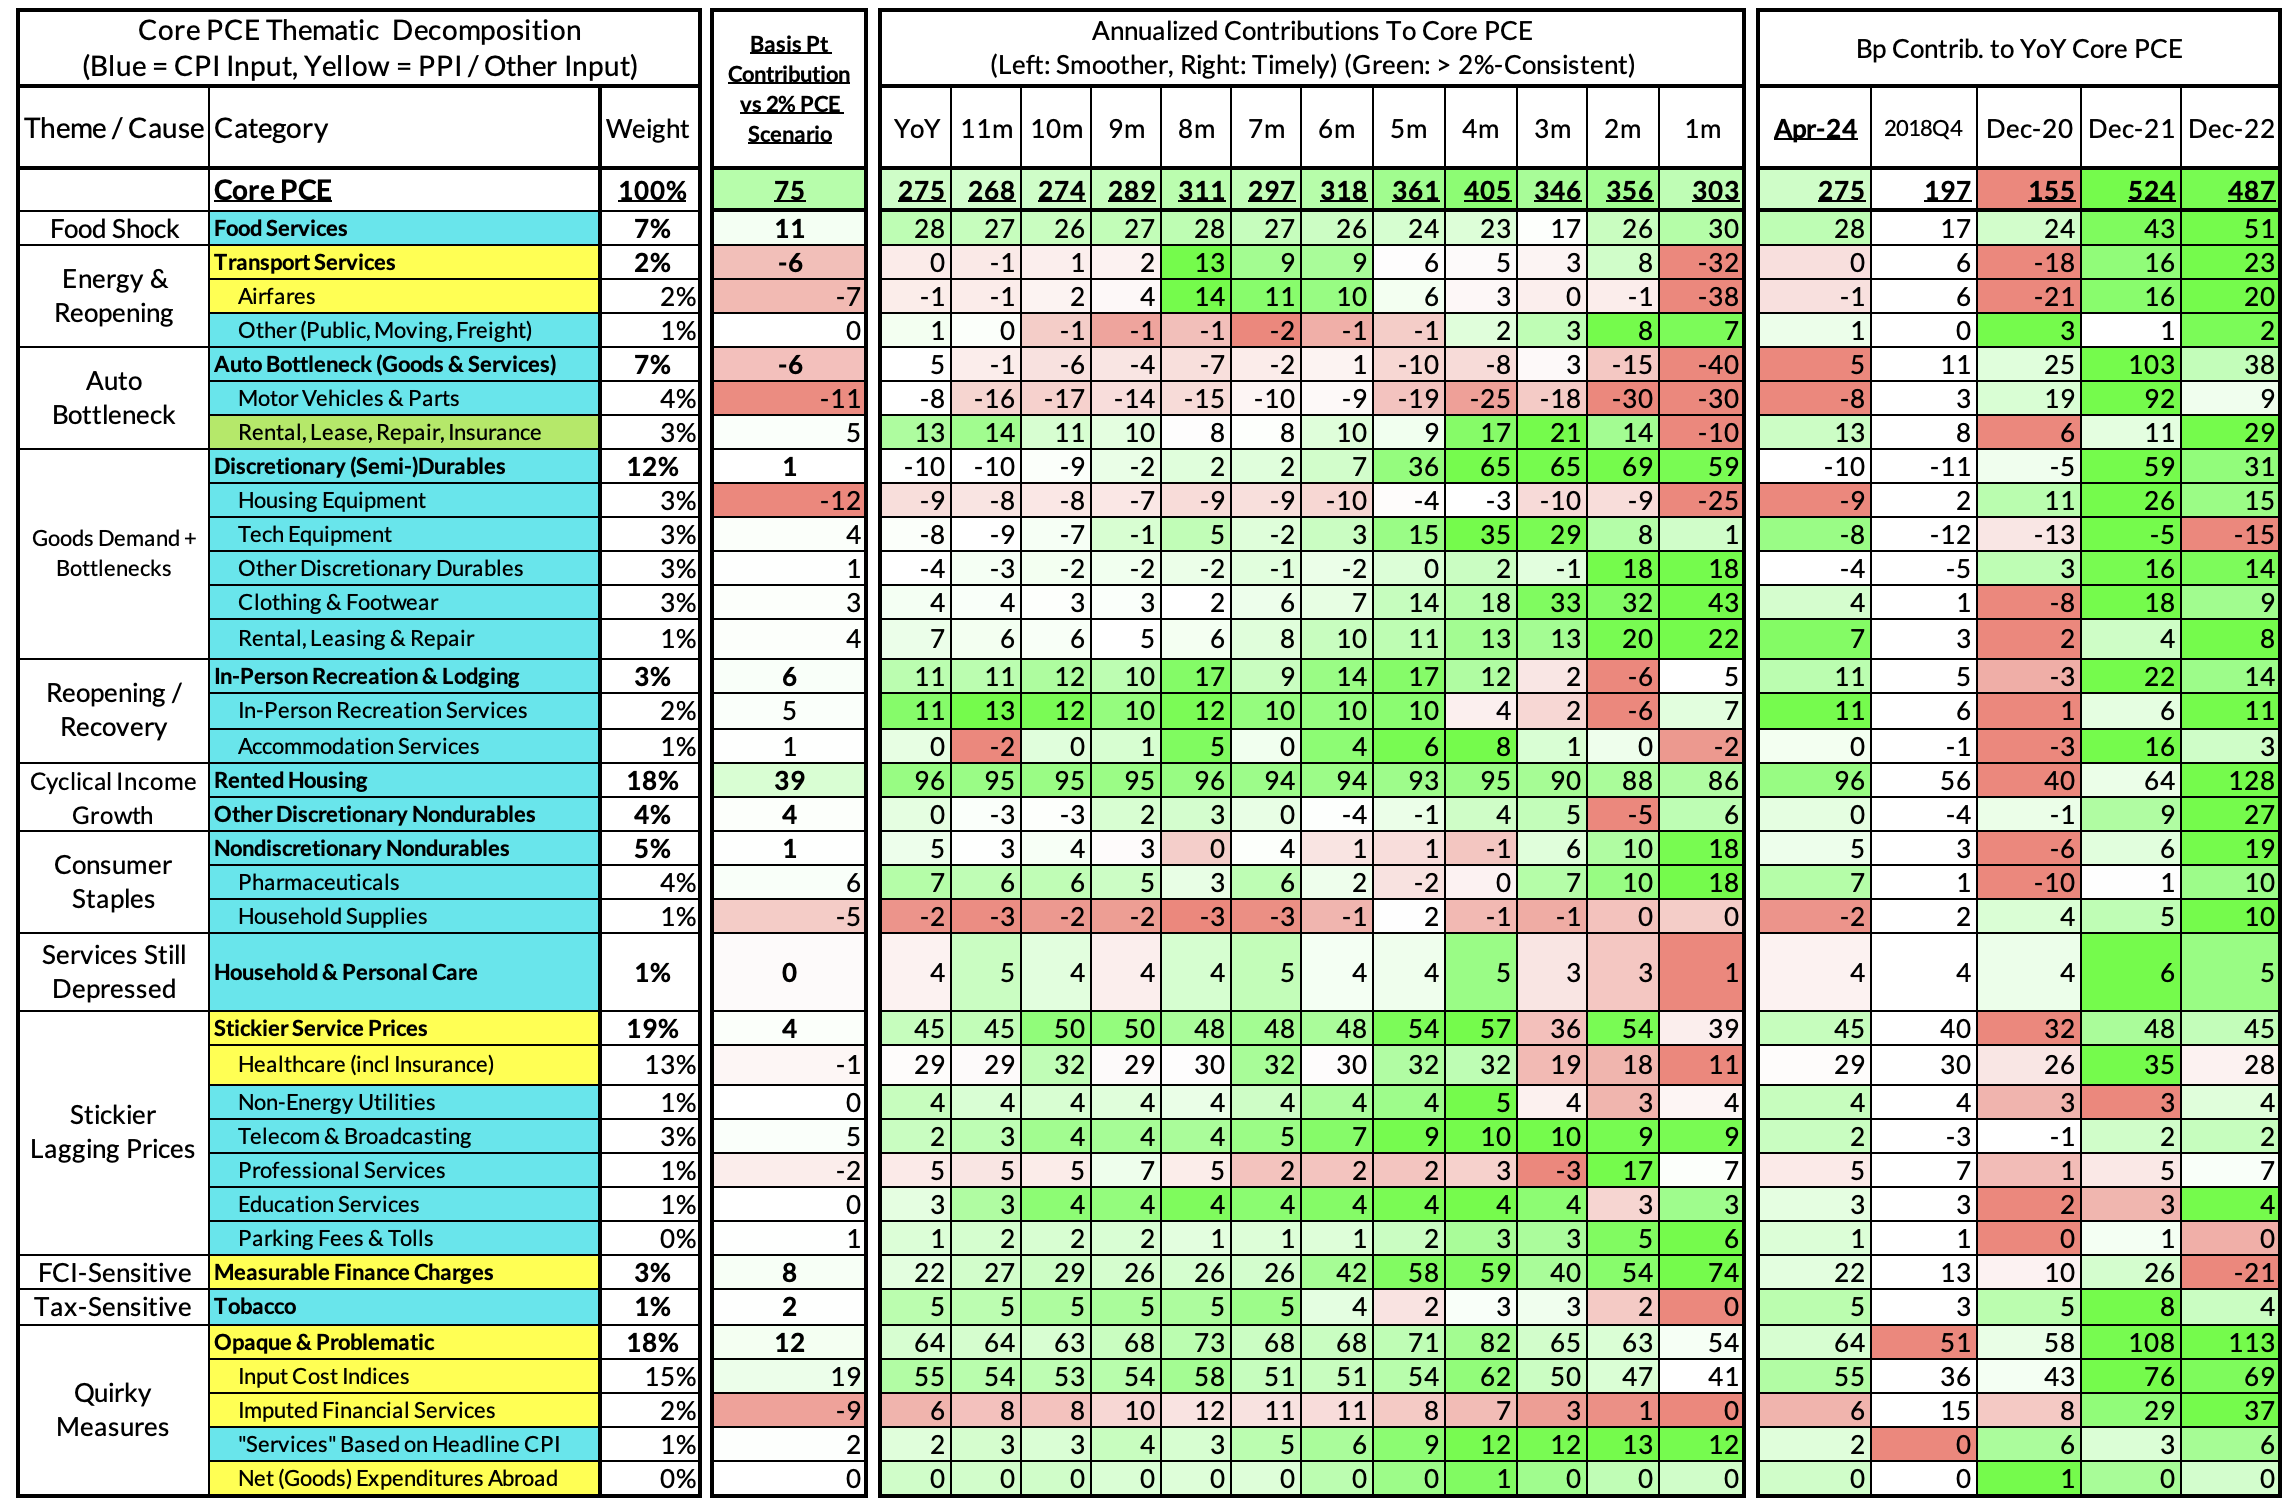
Core PCE Causal Segments vs Target-Consistent Growth Rates
For the Detail-Oriented: Core PCE Heatmaps
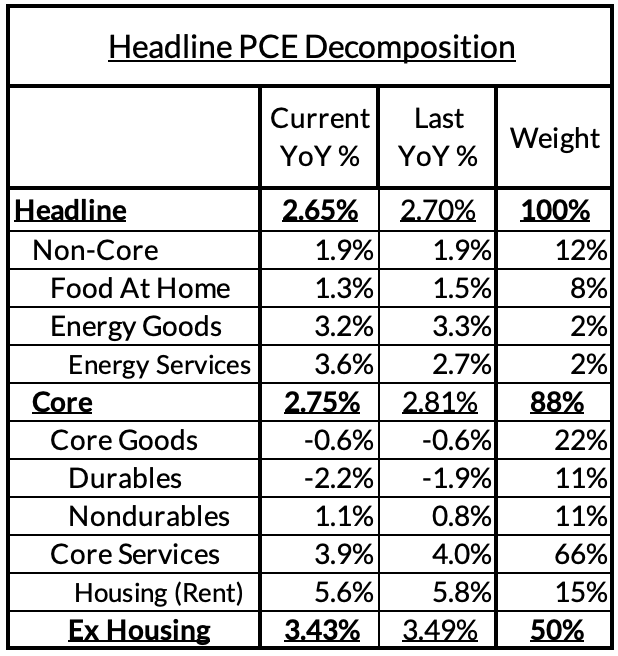
Core PCE (PCE less food products and energy) ran at a 2.75% year-over-year pace as of April, 75 basis points above the Fed's 2% inflation target for PCE. That overshoot is disproportionately driven by catch-up rent CPI inflation in response to the surge in household formation (a byproduct of rapidly recovering job growth) and market rents in 2021-22. Rent is contributing 39 basis points to the 75 basis point core PCE overshoot.
There are other contributors to the overshoot:
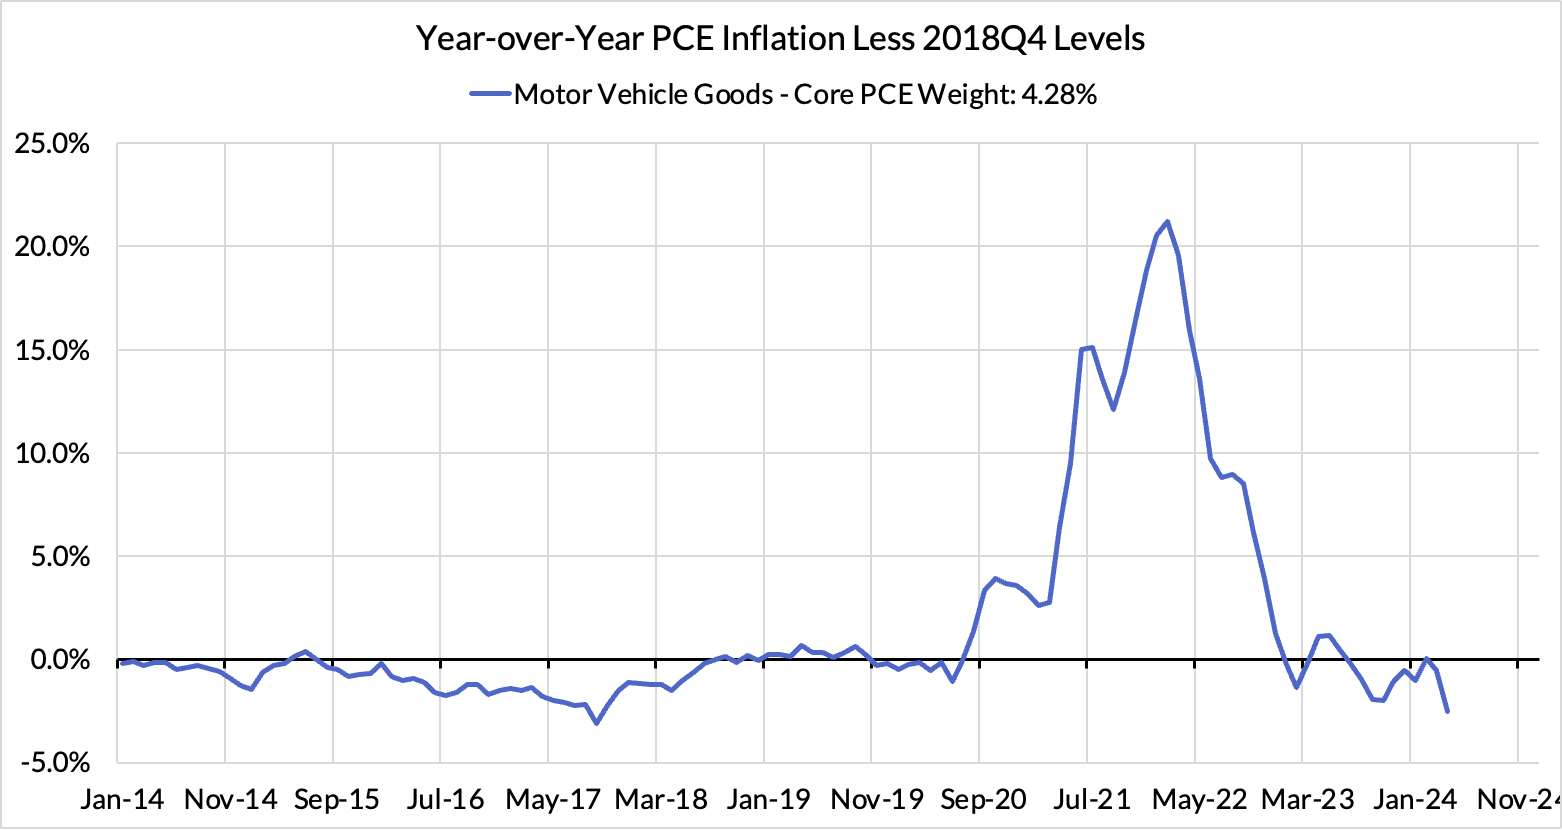
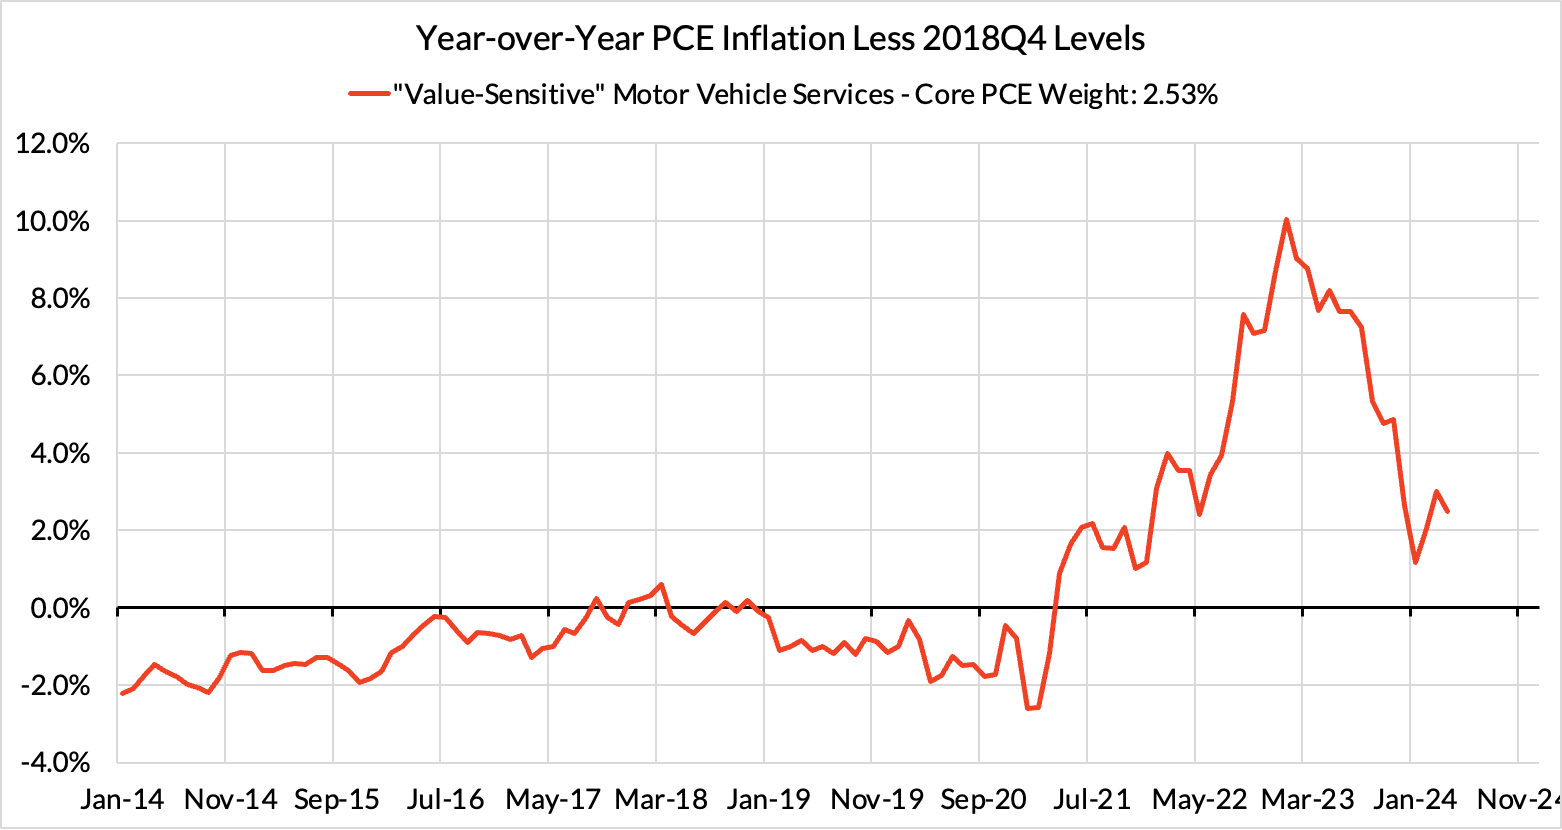
Some more supply-driven (food inputs likely added 11 basis points to the overshoot, motor vehicle bottleneck relief now subtracting 6 basis points)
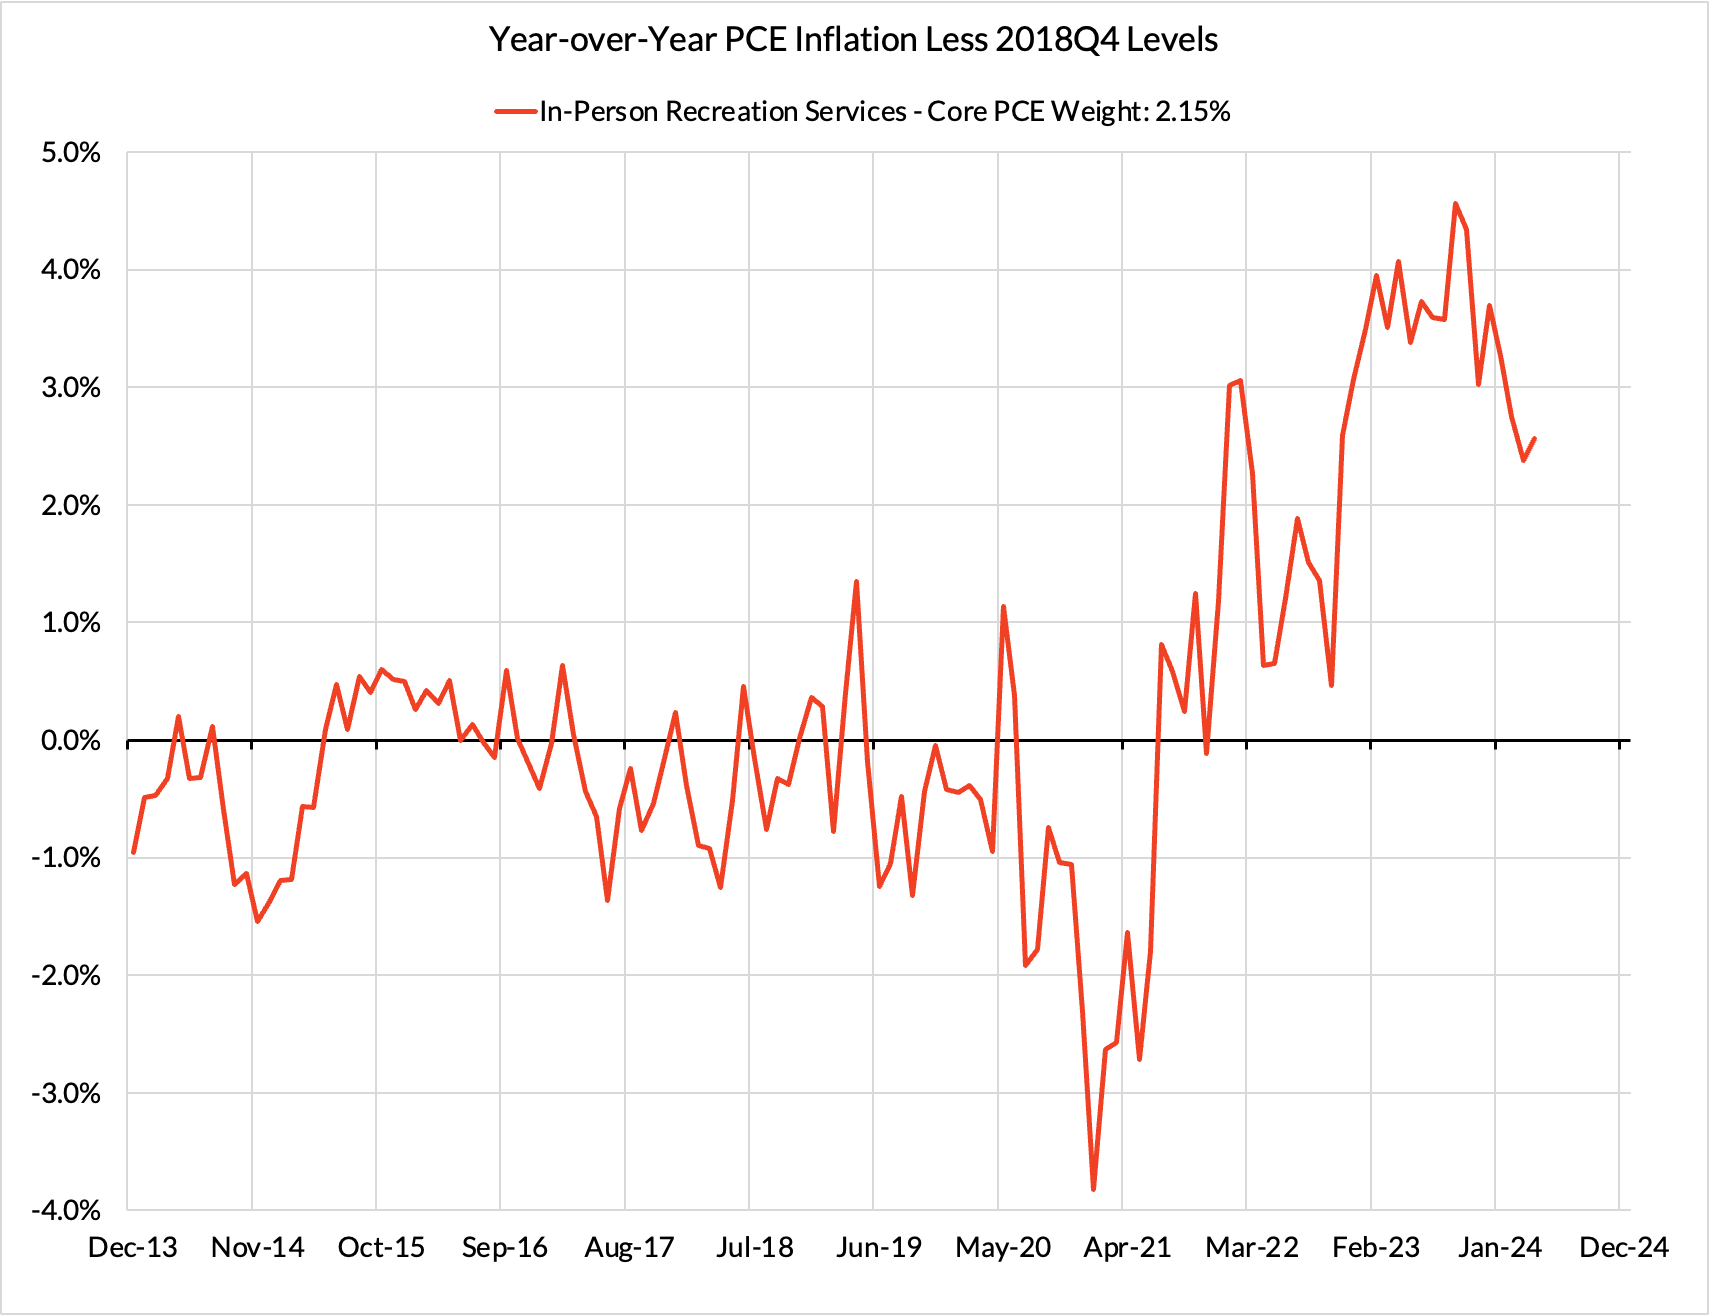
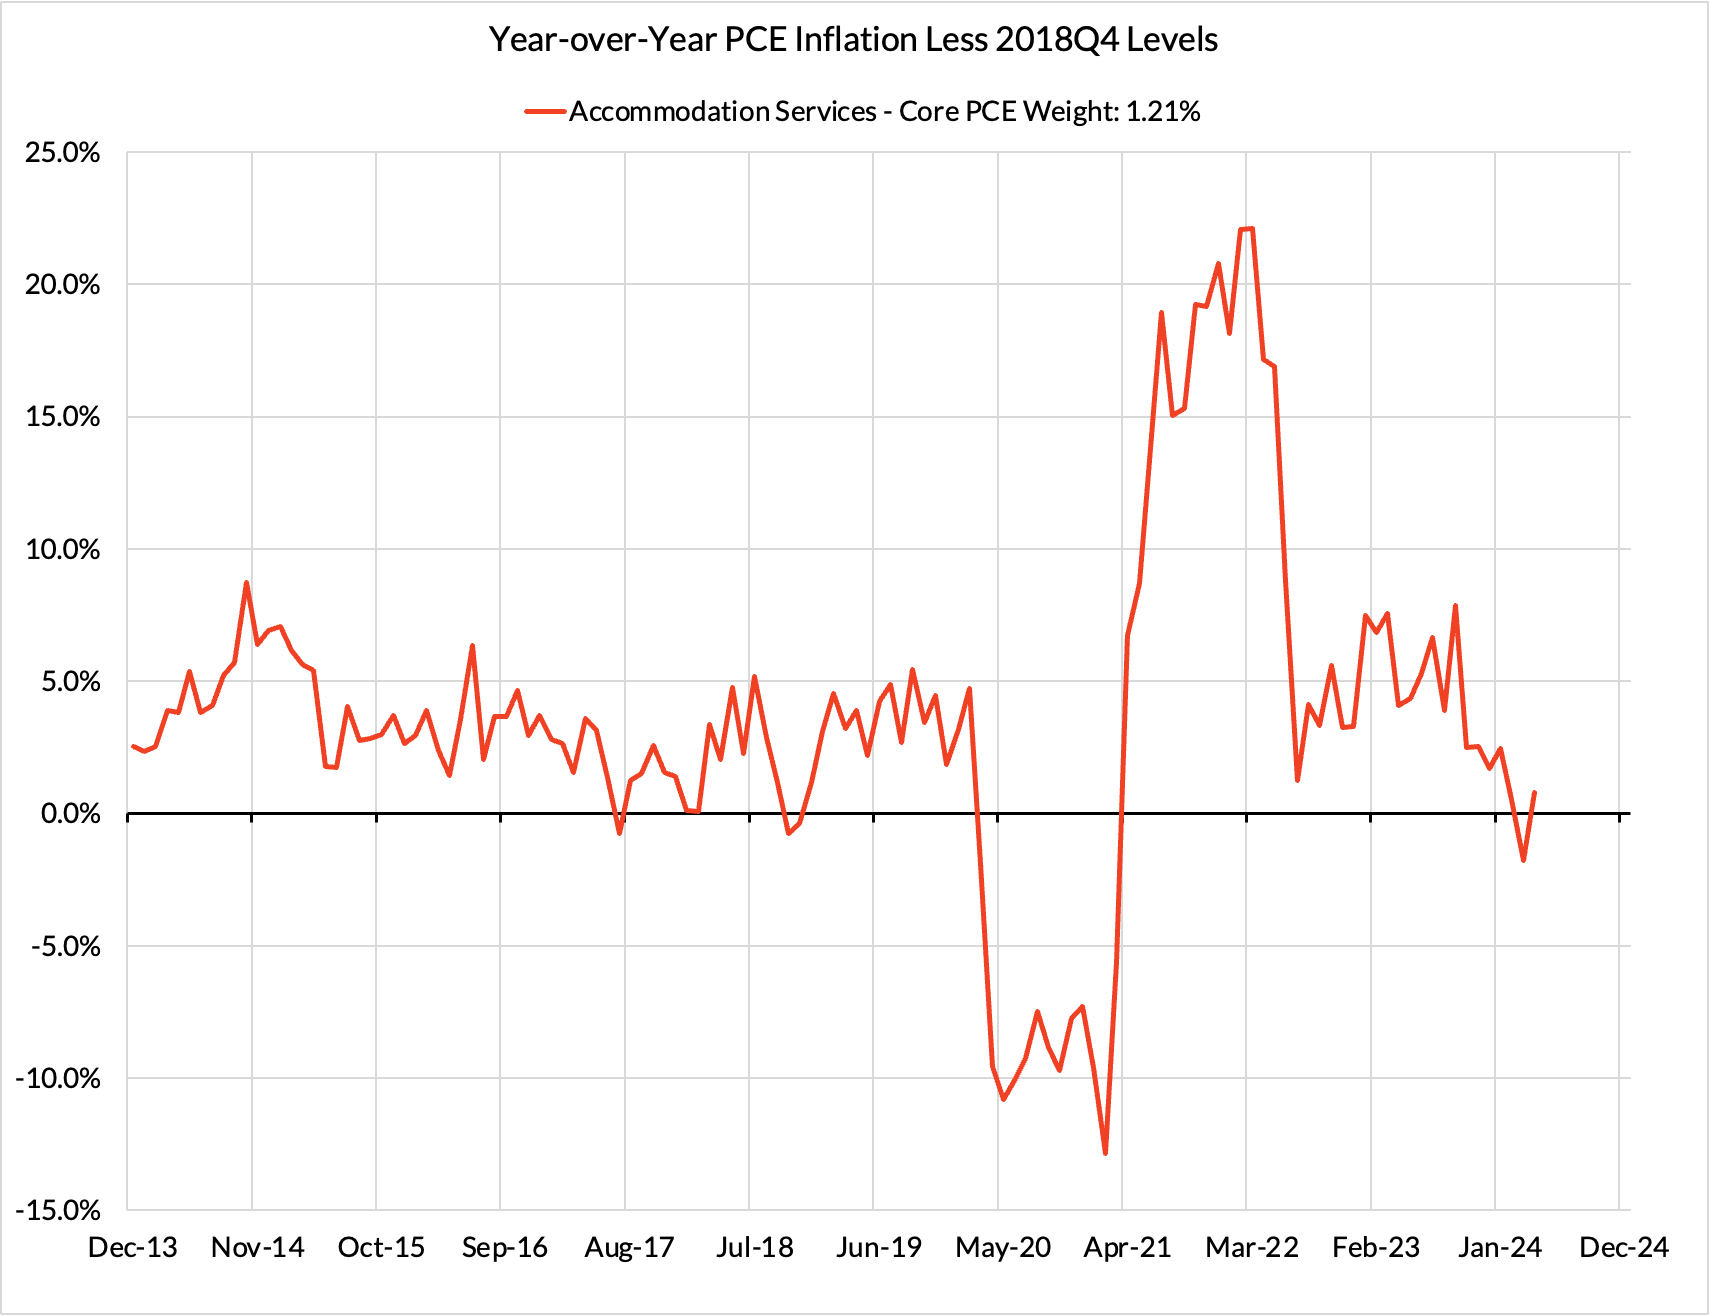
Some more demand-driven (in-person recreation and lodging services likely added 6 basis points to the overshoot)
Some oddball segments have aggravating effects (measured financial service charges now likely adding 8 basis points, while contributions from input cost indices adding 19 basis points to Core PCE vs 2%-consistent outcomes).
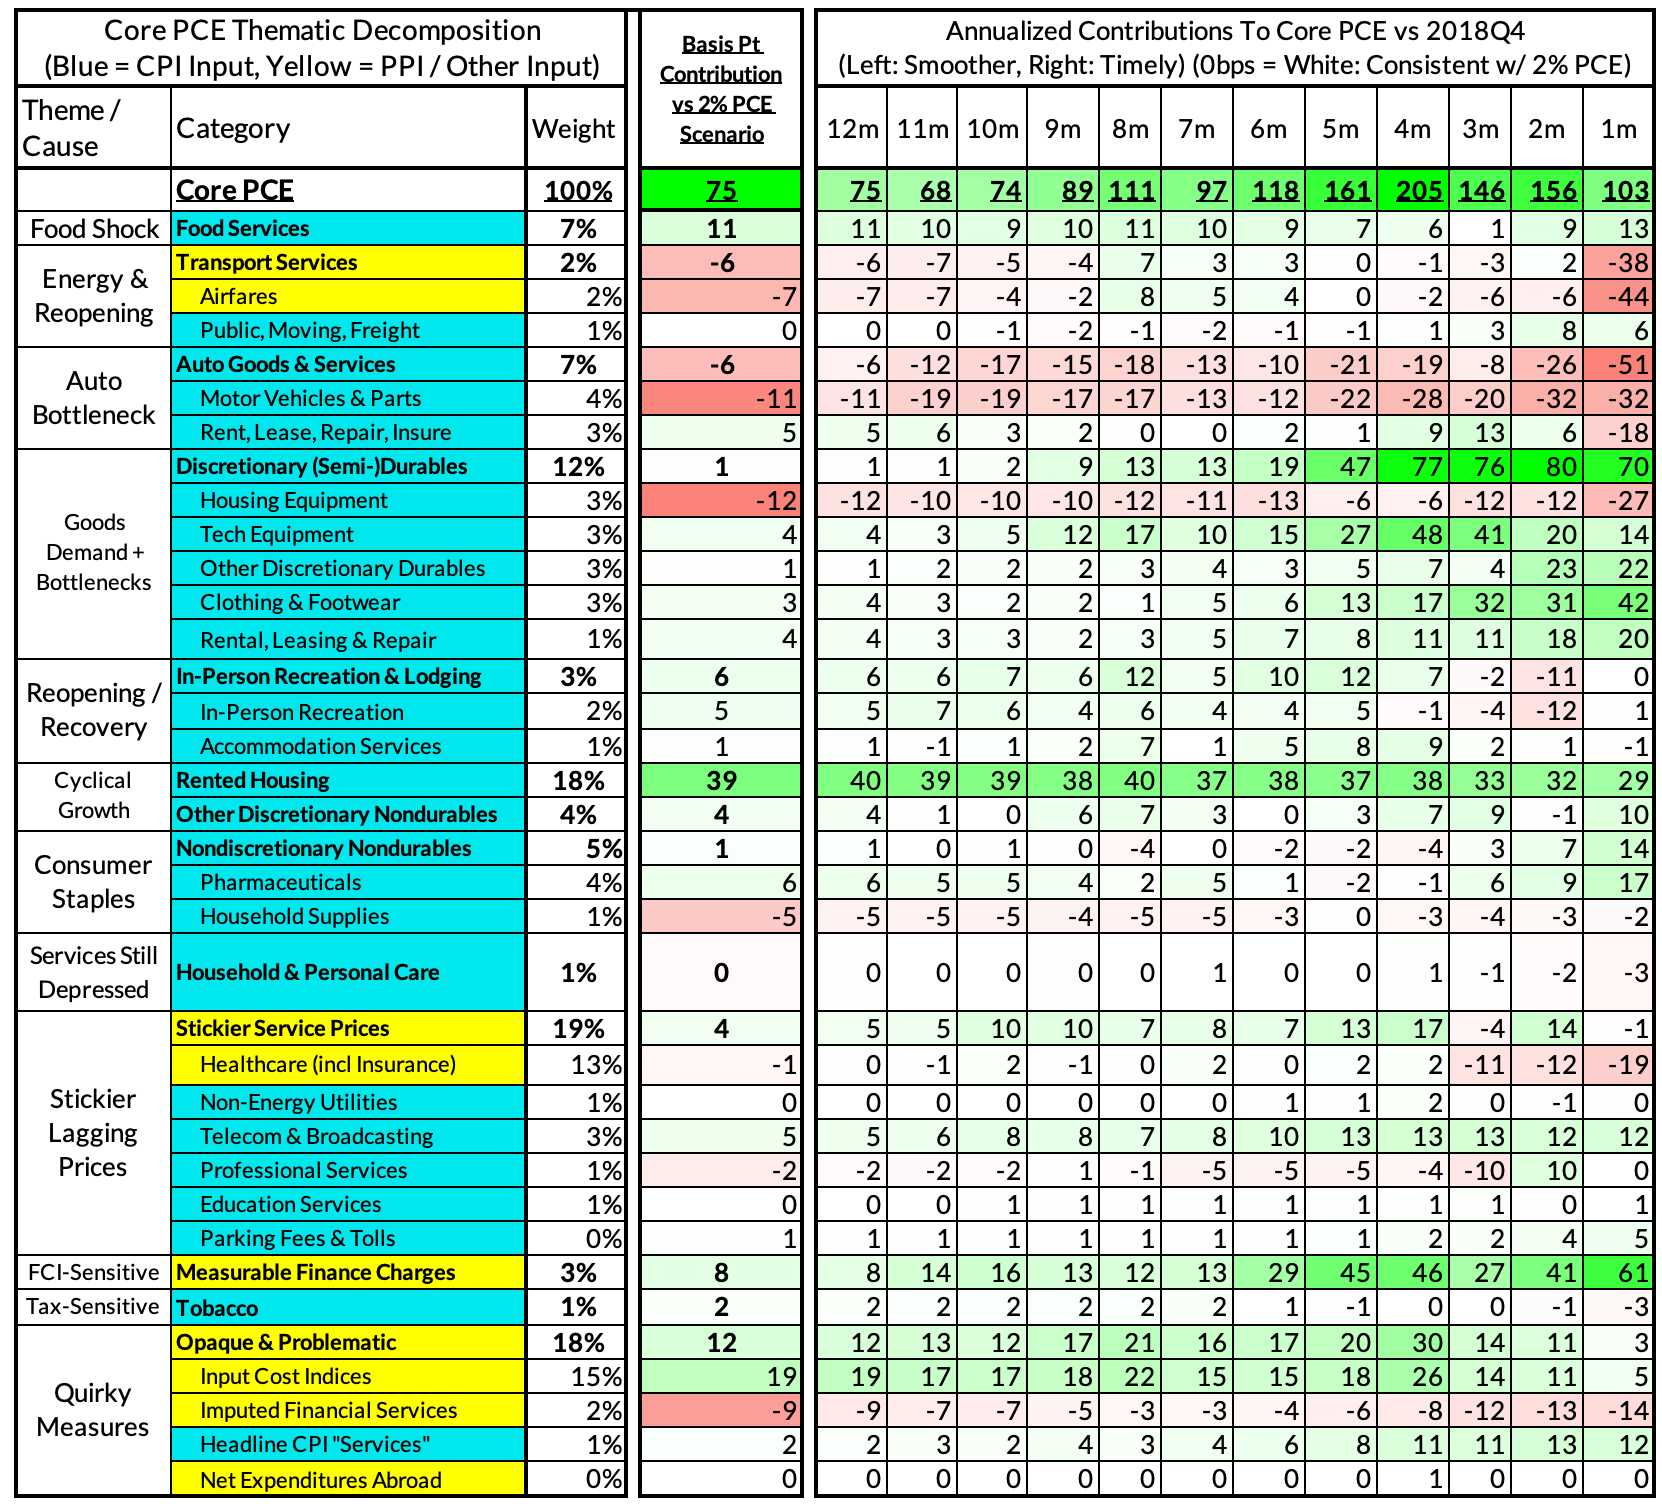
The final heatmap below gives you a sense of the overshoot on shorter annualized run-rates. April monthly annualized core PCE yielded a 103 basis point overshoot vs 2% target inflation (3.03% annualized).
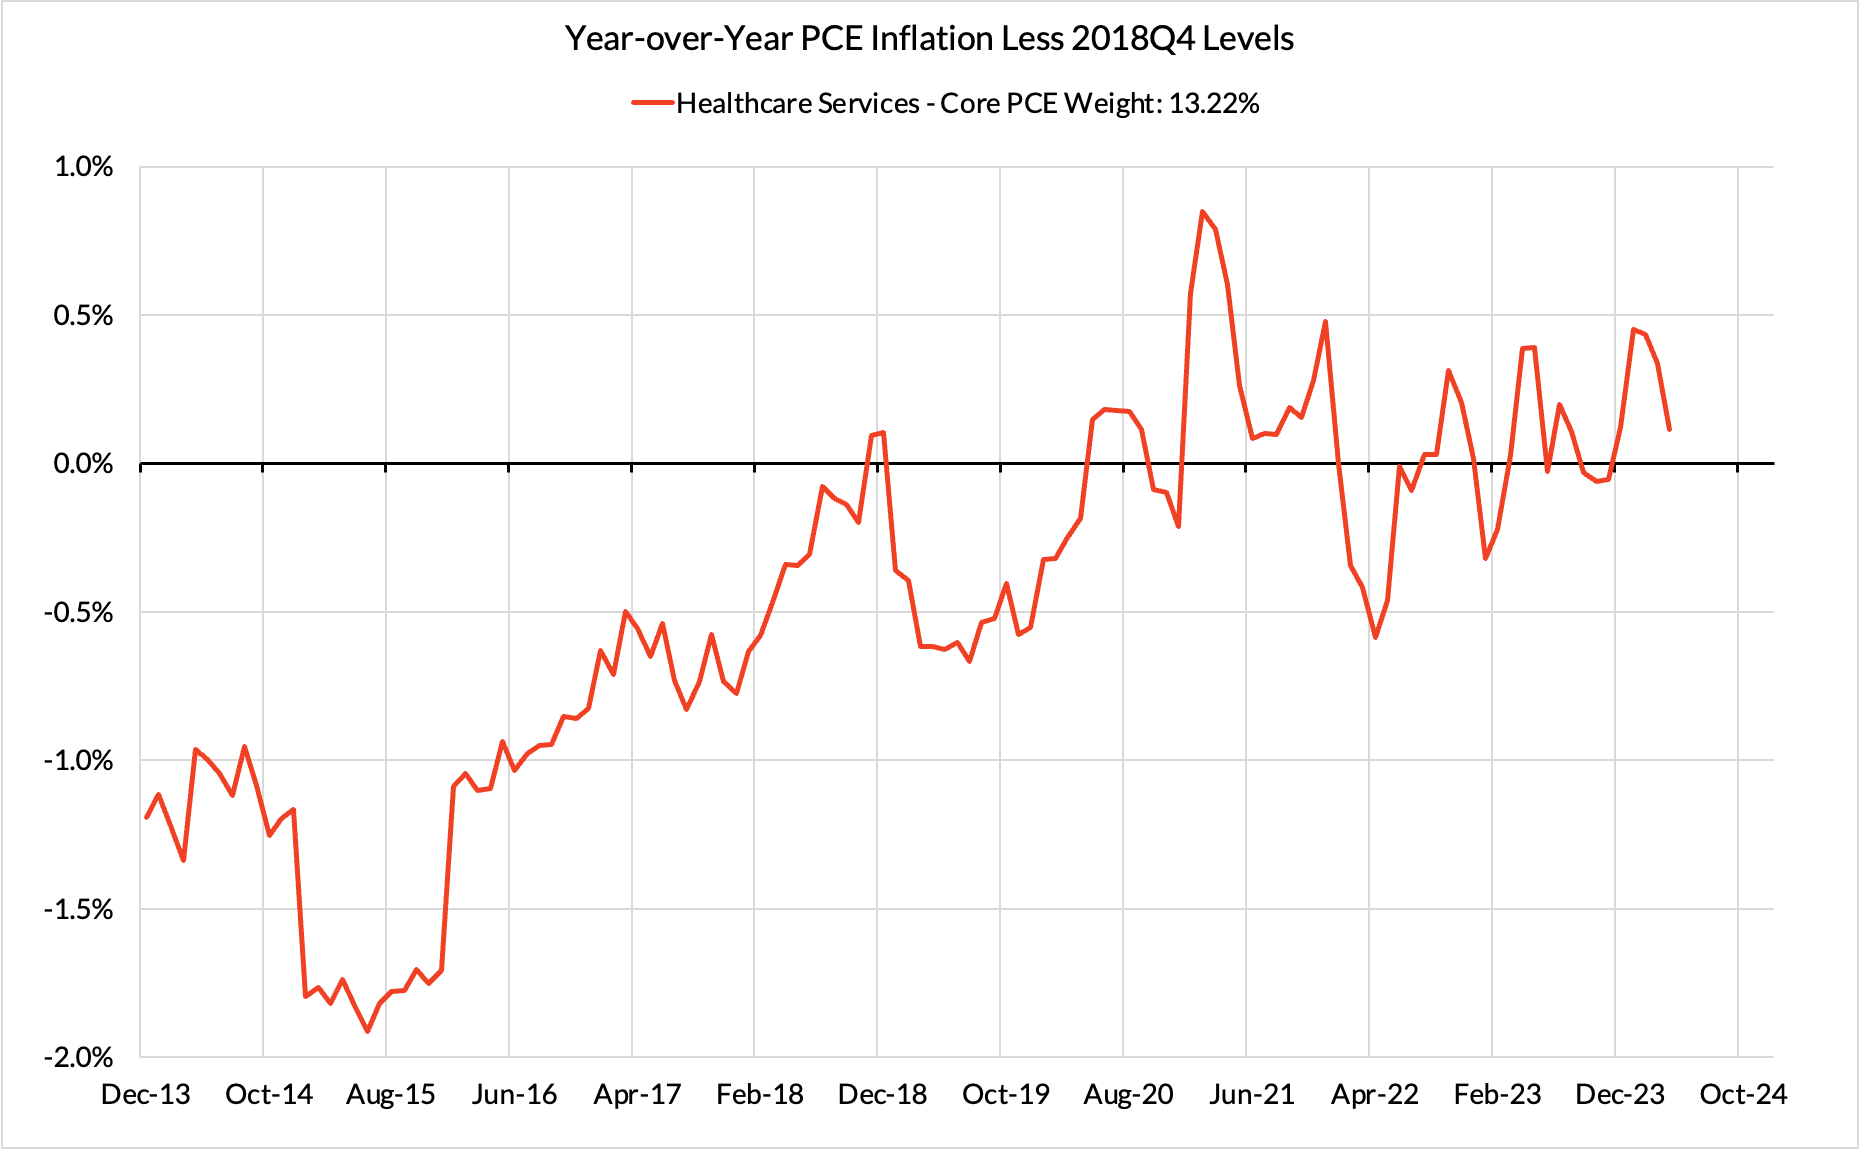
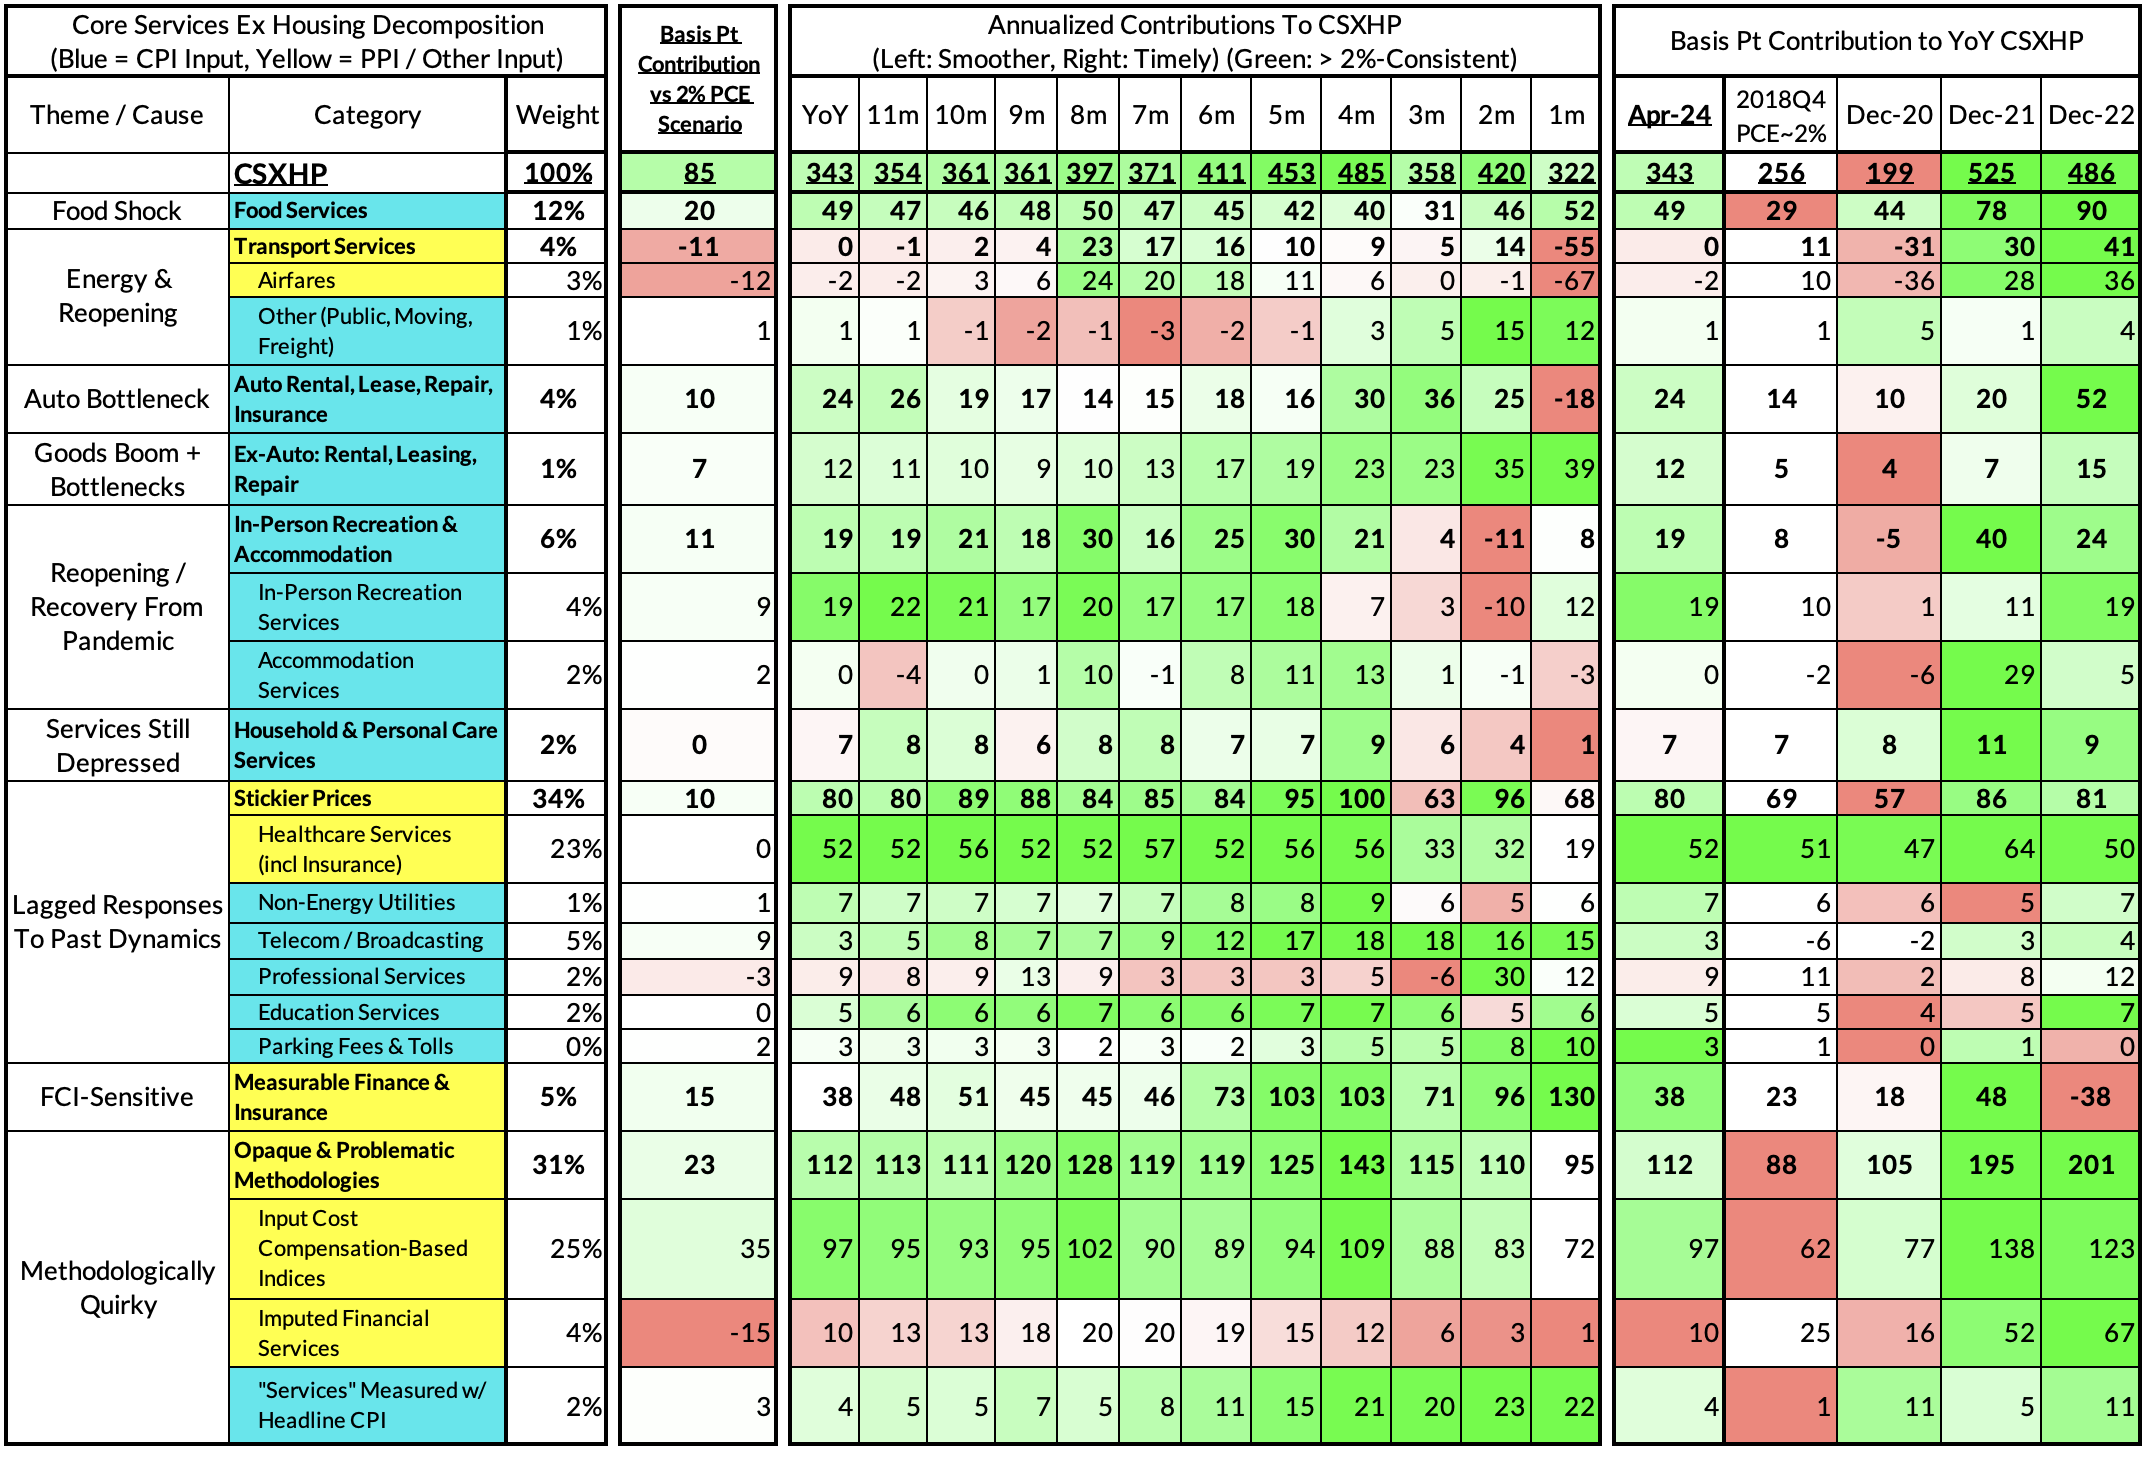
For the Detail-Oriented: Core Services Ex Housing PCE Heatmaps
The April growth rate in "Core Services Ex Housing" ('supercore') PCE ran at 3.43% year-over-year, an 85 basis point overshoot versus the ~2.59% run rate that coincided with ~2% headline and Core PCE.
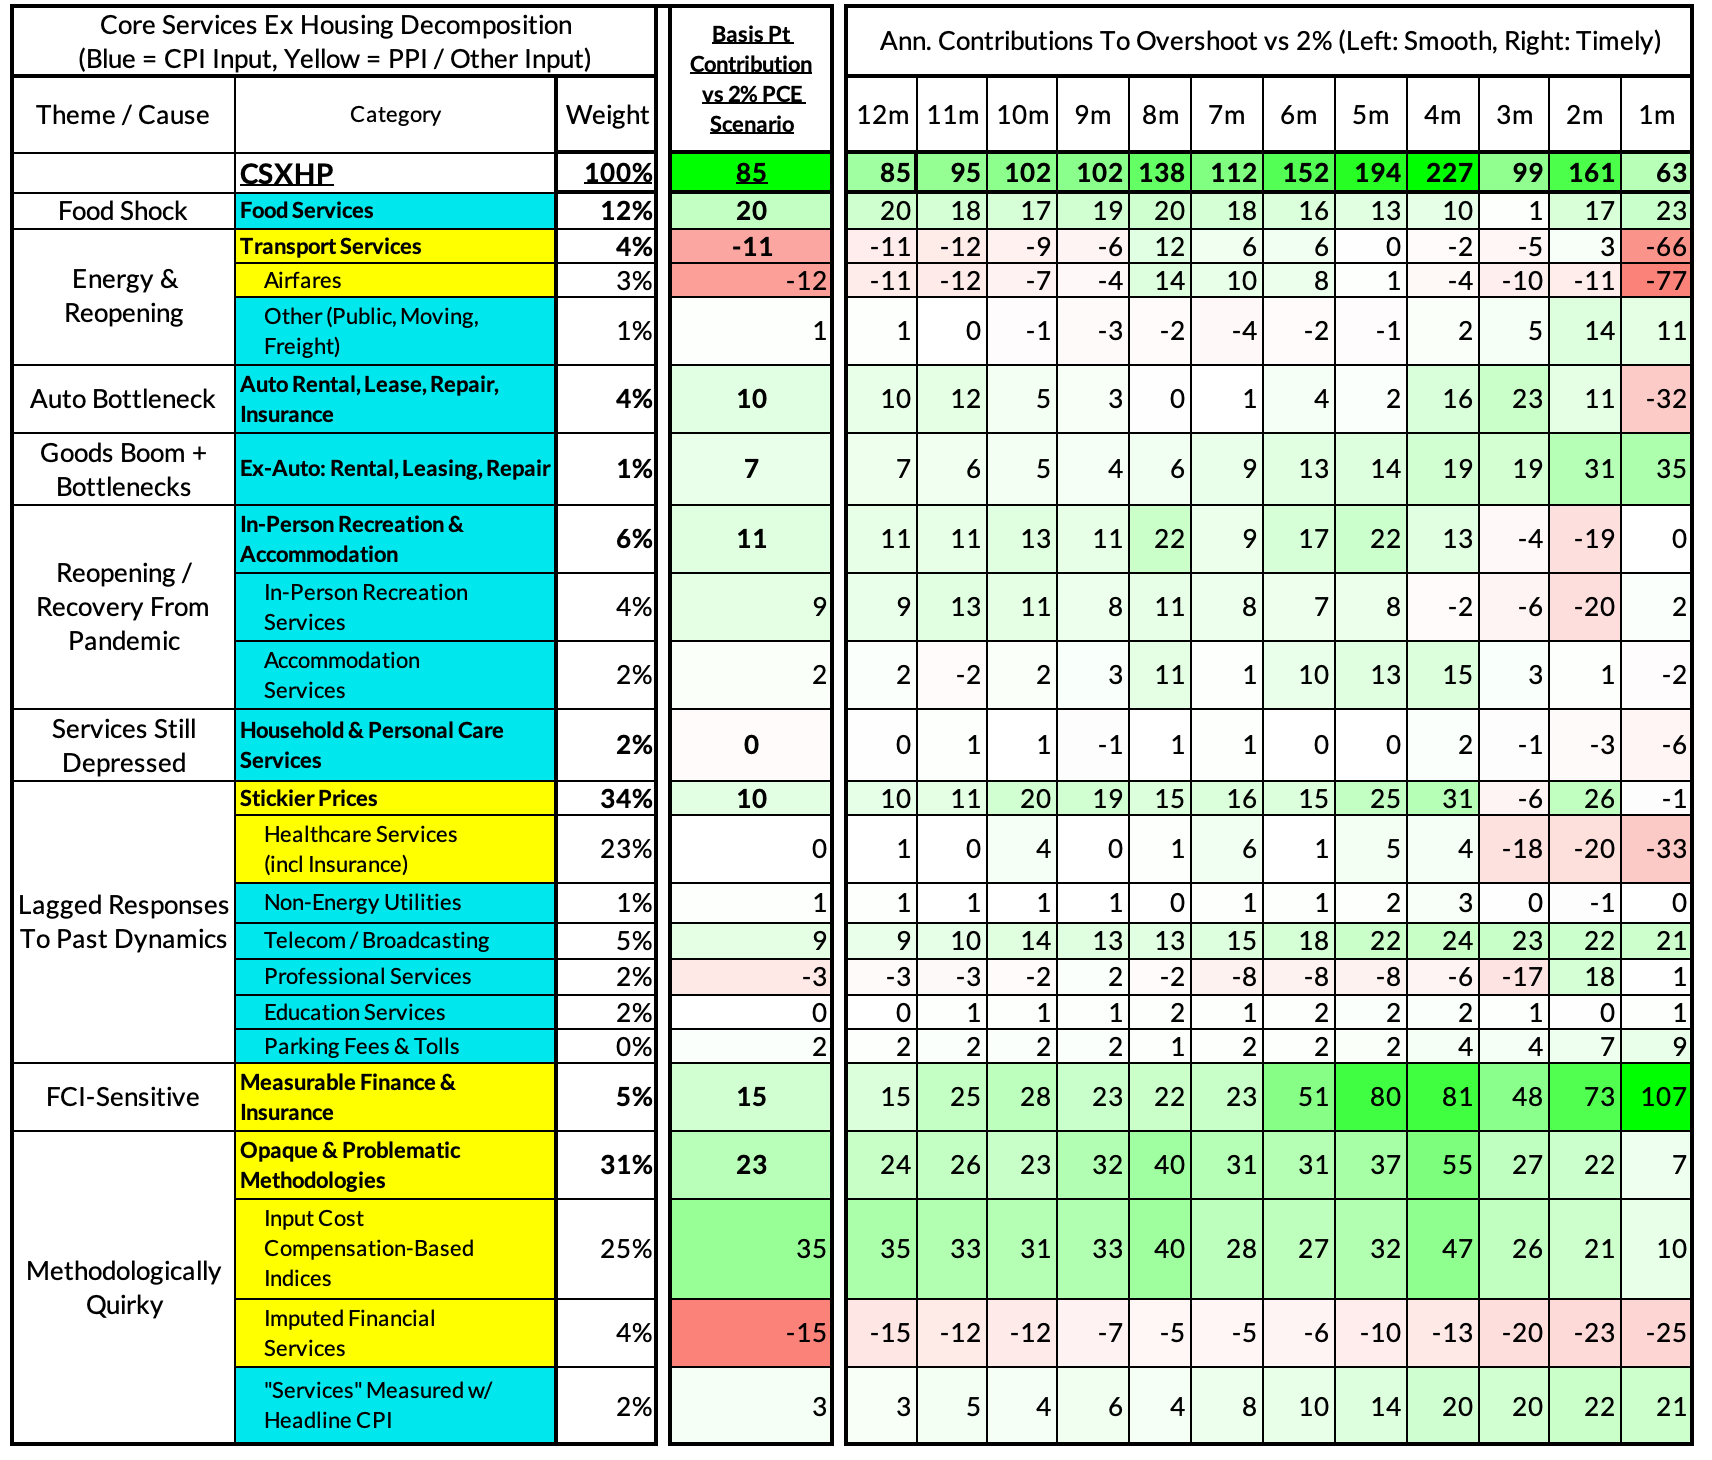
April monthly supercore ran at a 3.22% annualized rate, a 63 basis point annualized overshoot of what would be consistent with 2% headline and core PCE.
The link has been copied!
Your link has expired. Please request a new one.
Your link has expired. Please request a new one.
Your link has expired. Please request a new one.
Great! You've successfully signed up.
Great! You've successfully signed up.
Welcome back! You've successfully signed in.
Success! You now have access to additional content.